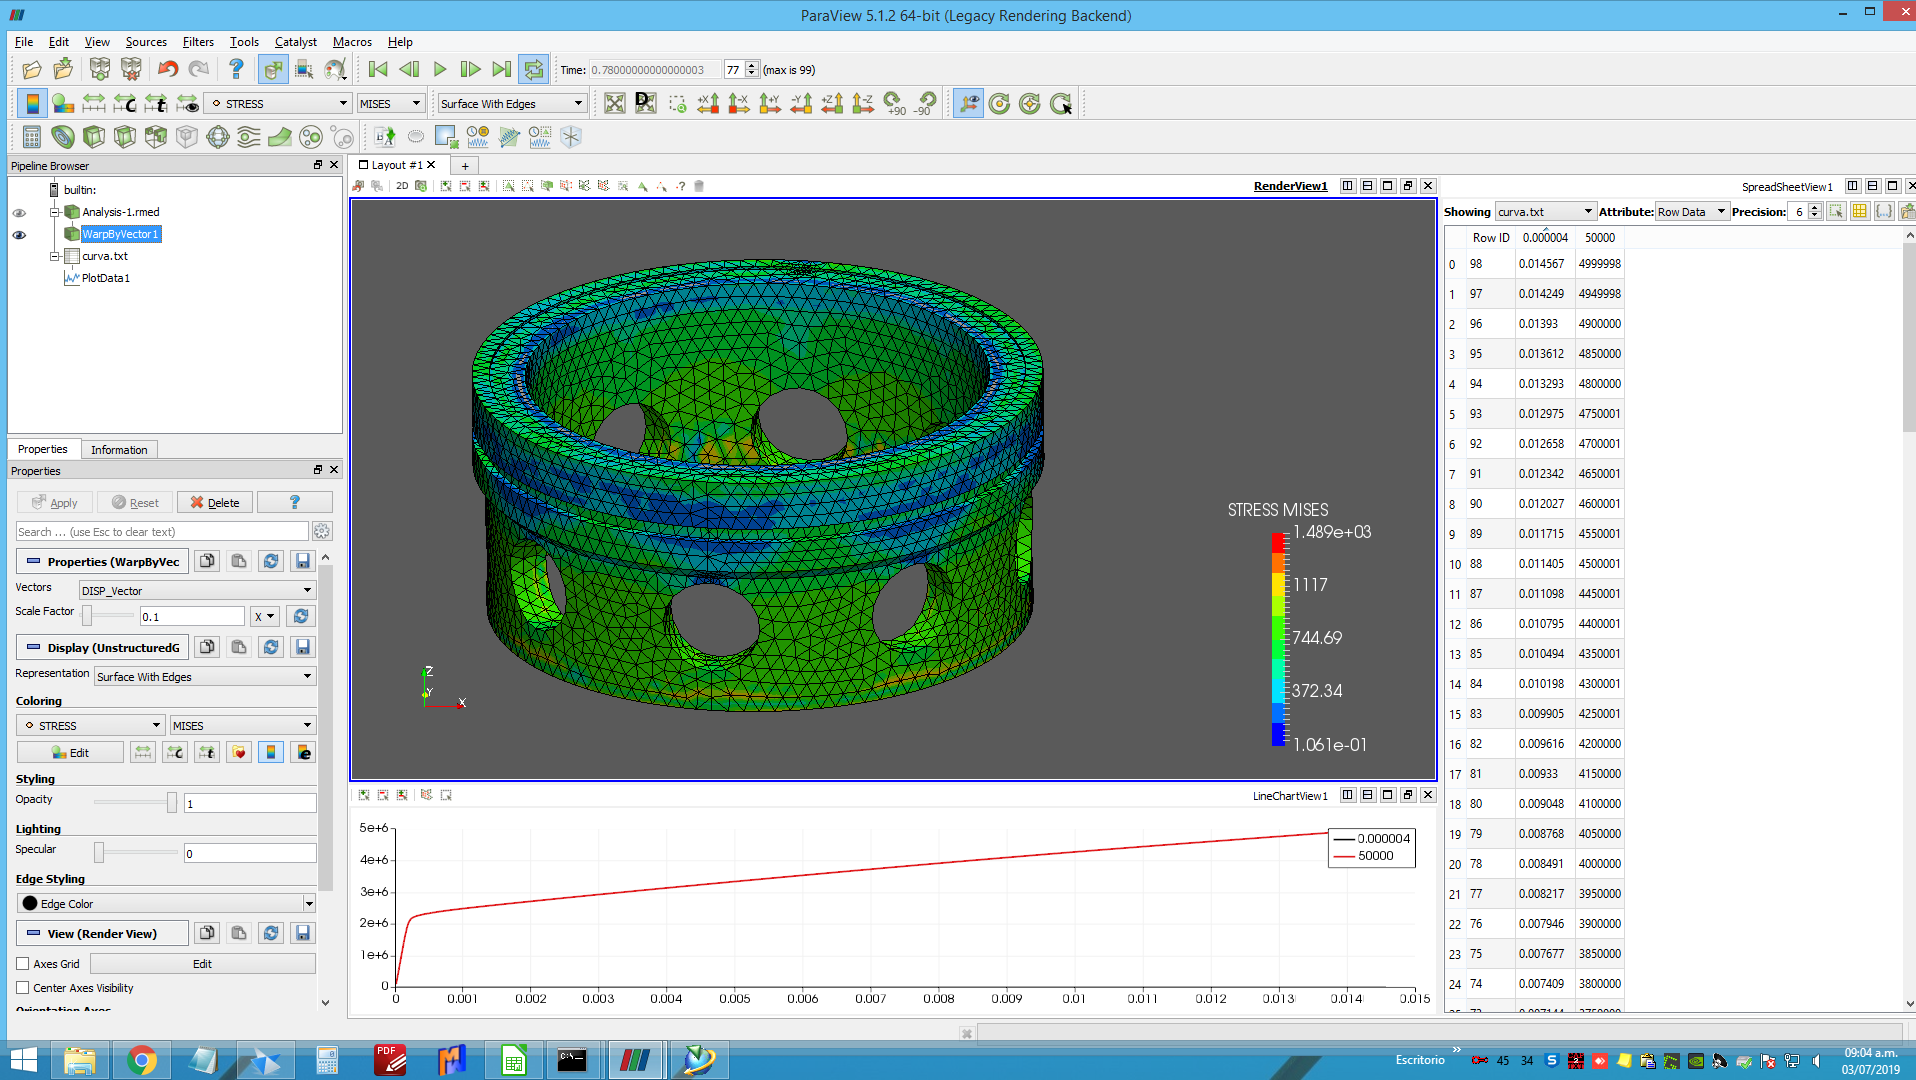
Hi, I have a no lineal simulation with 99 time increments, and in the other side a txt file with the load/deflection curve data points (also 99 rows). I managed to import the txt file and plot the curve, but is there a way to sinchronize the xy plot with the timed data in order to have the “vertical movil cursor” (the vertical line that follow the time data) as the “Plot Selection Over Time” filter?
Best regards
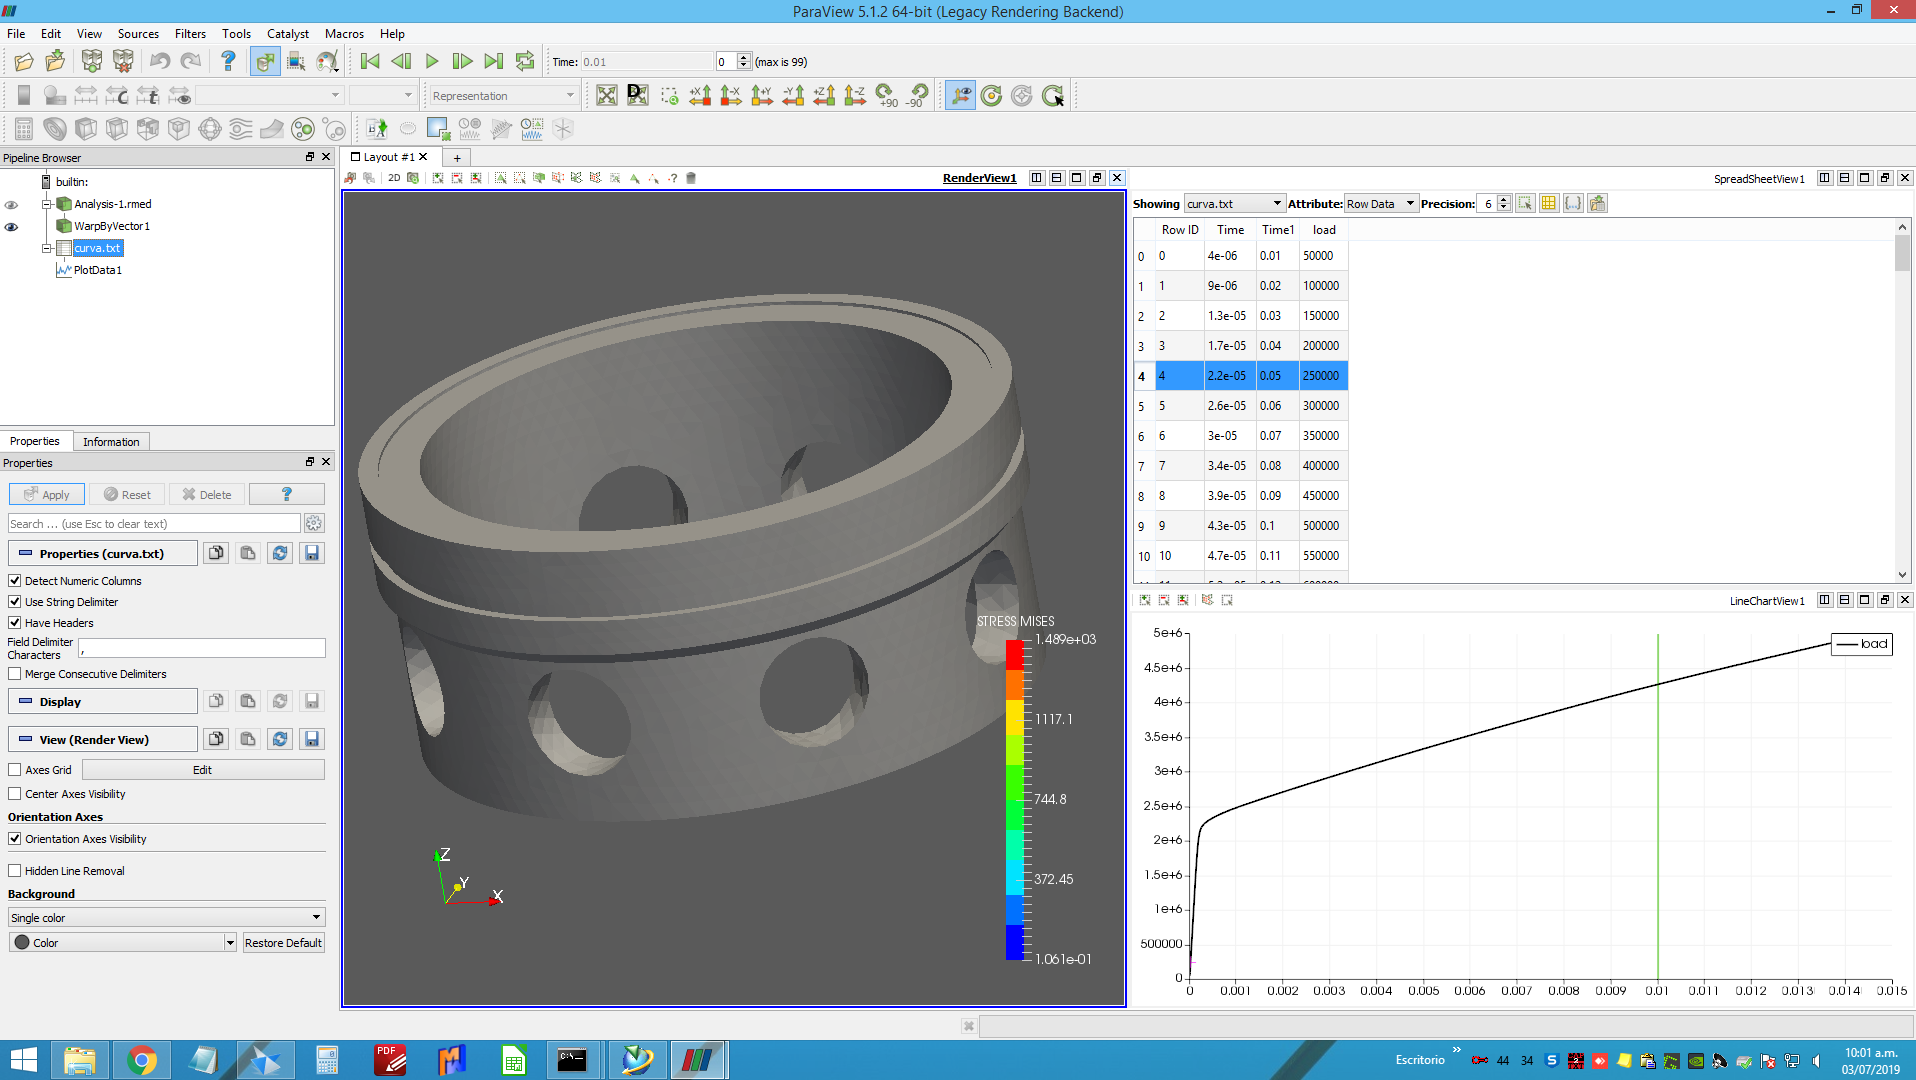
Try adding a header row to your curve.txt file and then naming the column with the time data as Time. The plot simply uses the name for the array used as the X axis to determine if and where the vertical moving cursor should be rendered.
@utkarsh.ayachit , mi curve.txt file had three column: time (from 0.01 to 1), displacement (from 4e-6 to 0.015) and load (from 5000 to 5000000). Have renamed the time column to time1 and displacement to Time, and now I can see the vertical cursor. My XY plot is a load/deflection so I’m using the displacement (now Time) column for X axis, so now, the vertical cursor appears, but at the firt increment (time 0.01), and the next one will be time 0.02, but this is away from the data (as my displacement goes up to 0.15).
Is clear? My x axis is displacement, not time
If your X axis is not time exactly then there’s no way to support it currently.
Thanks for your support. Even if is not possible the sinchronization still is very valuable to have this curve. Best regards.