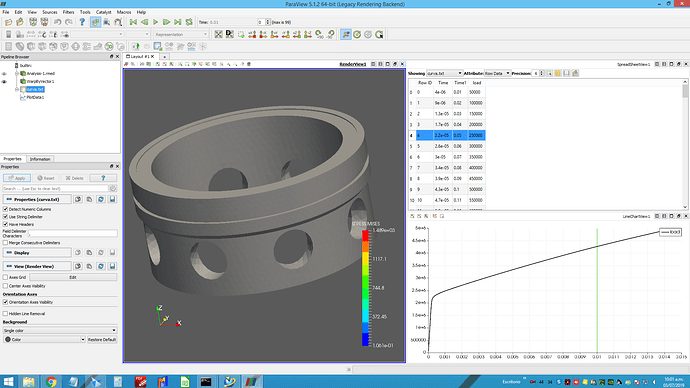
@utkarsh.ayachit , mi curve.txt file had three column: time (from 0.01 to 1), displacement (from 4e-6 to 0.015) and load (from 5000 to 5000000). Have renamed the time column to time1 and displacement to Time, and now I can see the vertical cursor. My XY plot is a load/deflection so I’m using the displacement (now Time) column for X axis, so now, the vertical cursor appears, but at the firt increment (time 0.01), and the next one will be time 0.02, but this is away from the data (as my displacement goes up to 0.15).
Is clear? My x axis is displacement, not time
