My intention is to write a plugin that shows one or several charts, i.e. 2D graphic like “histogram view” (one chart) or “matrix view” (multiple charts in one view).
After having written other plugins, I think that my best teacher would be a good example: Anything that somebody wants to recommend?
I don’t see an obvious example in Examples/Plugins, but there are of course chart plugins in the “real code”. However, not all may be ideal “teachers”, including some “good practice” - whatever that is…
There might be examples entirely or partially in Python, but so far for me C++ is “easier” - because I am more used to it. However, I am not against learning new things either!
The amount of works depends a lot on what you are trying to achieve.
You either needs to use the same VTK chart classes with other XML properties, easy.
Or you need to inherit them in VTK, more hard.
A very simple entry point would be : Examples/Plugins/OverrideXMLOnly/OverrideXMLOnly.xml wich demonstrate how to create your own Line Chart View without writing a VTK chart class.
A more complex one would be : Plugins/BagPlotViewsAndFilters (in master) where three new chart views are defined, with one based on PlotMatrixView.
I am afraid that XML only will not be enough! However I do not know exactly yet what my customers really need, but as far as I understand today it should be some display with “several charts”. So this is in principle what I see so far:
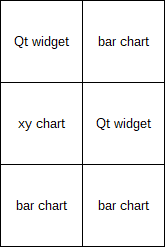
Meaning: a “view” and a “representation” that has one table as input (where specific attributes need to be present), and then a matrix of different charts and maybe chart types, but nothing special there (bars, points, lines - like Paraview can already do). And maybe also one or two “cells” with custom Qt widgets (where writing them is for me no magic - only I need to find the point where I have to “attach” them).
For all the standard charts I would have to prepare the input properly, but that part also looks like “no magic” to me.
At this moment I am only preparing for that job - because I did a lot in PV already, but no 2D charts!
Right now I am studying how the “matrix representation” is working, and I guess that the hint with the “BagPlotViewsAndFilters” might help me further if it is based on that one.
The BagPlog hint brought me on the probably right track:
I copied these BagPlot classes (inheriting from the plot matrix view/representation) and made them “empty” -> the resulting view/representation generated a plot matrix
removed the empty BagPlot classes and moved them one inheritance level “up”, so my view and representation classes became 1:1 renamed copies of the plot matrix classes -> test: still getting plot matrix from little test table
finally did the same with the vtkScatterPlotMatrix class - because I realized that this is actually the “heart” of the plot matrix classes -> same test ok
reformatted all the new clone classes with my own code formatting style: not because it is “better”, but for me this is the best way to learn what the code is actually doing!
Now I am ready to gradually change EVERYTHING in that plot matrix view!
(The question is whether I should start kicking out functionalities that I do not need - like the rather complex animation logic -, or probably better just leave it in for the moment…)
Bottom line: for me this is a way how source code becomes a “teacher” - after finding the right point to start with!
A learning about often used programming style in VTK/ParaView: I had to clone all these classes, instead of subclassing them, because they are all wrapping the “real thing” in some opaque internal class, only exposing an API that very often does not allow more than very little cosmetic changes. Ok, a second means to “hide the core” is of course private variables: the plot matrix view for example only needs to be cloned because the vtkScatterPlotMatrix pointer is “hidden” as private, so I need to clone the class in order to use my own clone of the vtkScatterPlotMatrix - which only gives me access to the “real working” of the plot matrix.
I assume that maybe it was not really the intention to make functions hard to subclass (for achieving major changes), but at the moment I am first of all happy it is working like it should! And if I look at what I want to achieve it is indeed a different thing than a scatter plot matrix, but rather some kind of “report with charts”