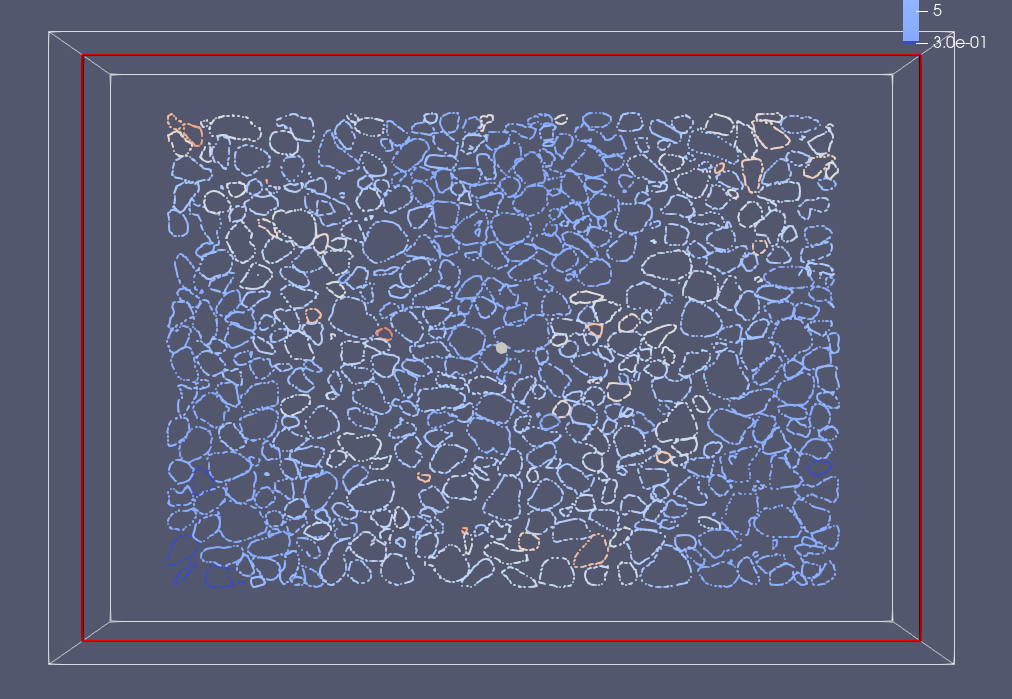
I’m working with an assembly of 3D bodies contained within a polygonal mesh in ParaView. These bodies are defined only by their surfaces, so when I slice them, I only obtain the outlines of these bodies, as shown below:
Now, I am interested in visualizing the scalar values assigned to each of these bodies. Ideally, I want to fill each outline with the color representing the scalar value of that body. Or rather, I would like to color the cross-section of each body according to the scalar value assigned to its surface points.
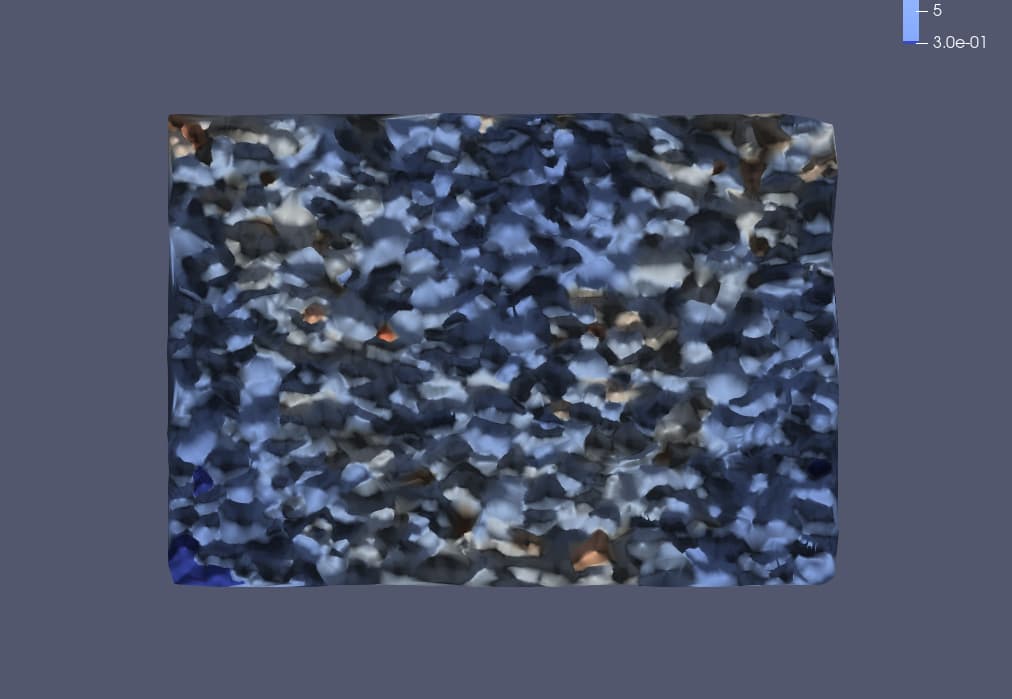
The best result I’ve managed to achieve was using the Delaunay2D filter, which provides an approximated “continuous” scalar field, which is far from satisfactory:
Thanks for your reply! I am actually working on the final steps of the solution and can, therefore, share the procedure I found to work.
import numpy as np
import paraview.simple as pvs

# Load the dataset and clean data
data = pvs.OpenDataFile("myfile.pvtp")
cleaned_data = pvs.Clean(Input=data)

# Generate surface normals (this may not be needed in general)
normals = pvs.GenerateSurfaceNormals(Input=cleaned_data)
normals.FlipNormals = True

# Slice the data
slice = pvs.Slice(Input=normals)
slice.SliceType.Normal = [0, 1, 0]
slice.SliceType.Origin = [508.7891912460327, 302.2244176864624, 364.30931854248047]


# Get the range of ID values
slice.UpdatePipeline()
slice_data = pvs.servermanager.Fetch(slice)
id_array = slice_data.GetPointData().GetArray('ID')

unique_ids = np.unique(id_array)

filled_surfaces = []

n = len(unique_ids)

# # Loop over each ID
for i,this_id in enumerate(unique_ids):
    # Threshold filter to isolate the current body
    threshold = pvs.Threshold(Input=slice)
    threshold.Scalars = ['POINTS', 'ID']
    threshold.LowerThreshold = this_id
    threshold.UpperThreshold = this_id
    threshold.ThresholdMethod = 'Between'

    # Apply Delaunay 2D to the thresholded body
    delaunay = pvs.Delaunay2D(Input=threshold)
    delaunay.ProjectionPlaneMode = 'Best-Fitting Plane'

    # generated surface normals (needed for correct lights)
    generateSurfaceNormals2 = pvs.GenerateSurfaceNormals(registrationName='GenerateSurfaceNormals2', Input=delaunay)

    # Store the result
    filled_surfaces.append(generateSurfaceNormals2)

    print(f"{i+1} out of {n}")


# Group all filled surfaces
grouped_surfaces = pvs.GroupDatasets(Input=filled_surfaces)
The idea behind it is to first isolate the single outlines by its ID, then to apply the Delaunay2D filter, and finally to recompute the normals (for visualization purposes, i.e. to have a homogeneous color and correct lighting).