I happen to be using this filter alot and it seems to be single threaded. Is there a way to recompile paraview and utilise multithreading for this?
I am also in need to use this filter with a sparse csv which I would like to pad with 0 in order to be able to use this filter which otherwise simply fails. Is there a good way to do this?
Do you also have a recommendation for the second part of my question. It would help alot. here is some sample data. inox.csv (188.8 KB)
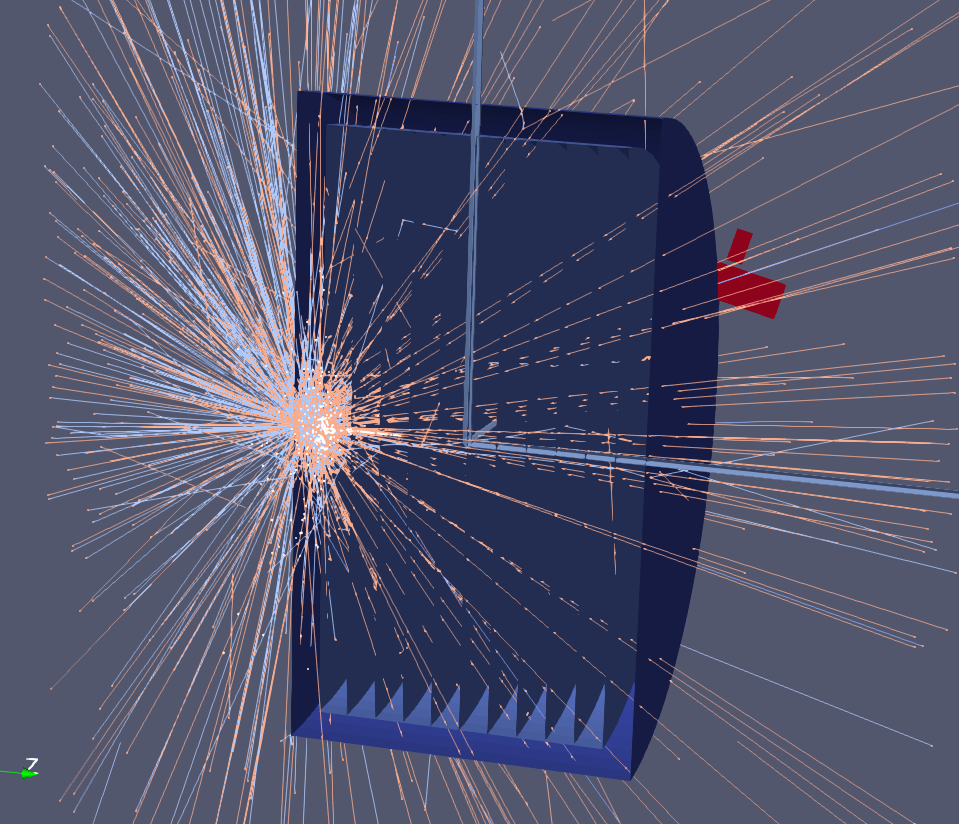
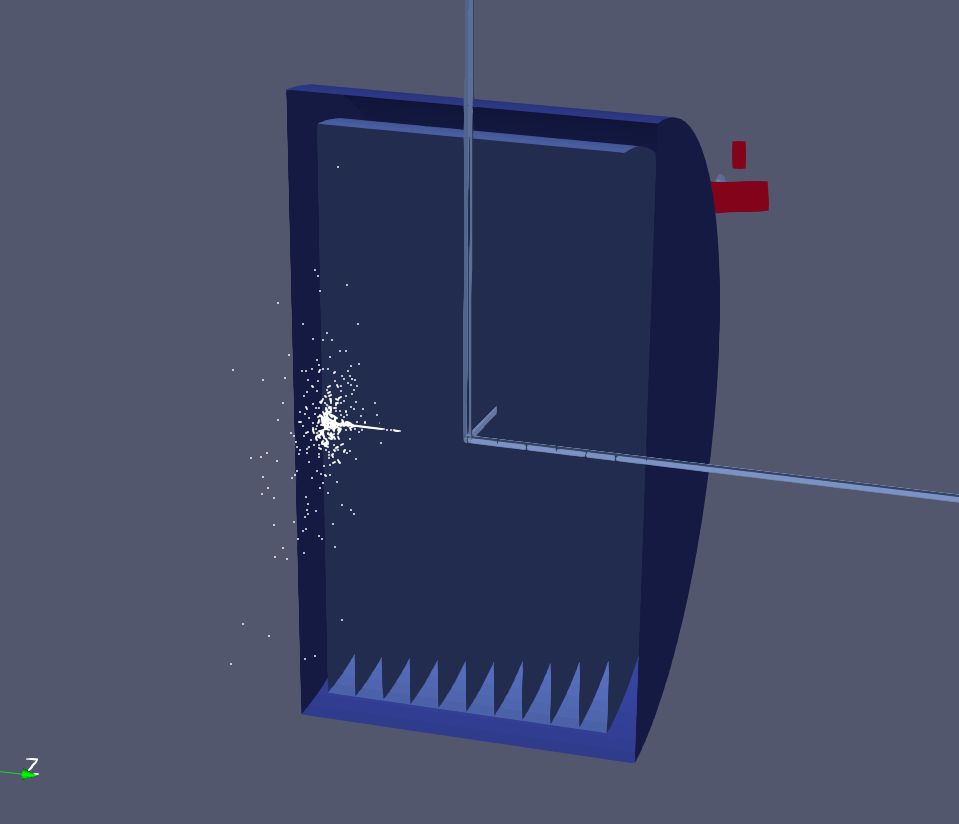
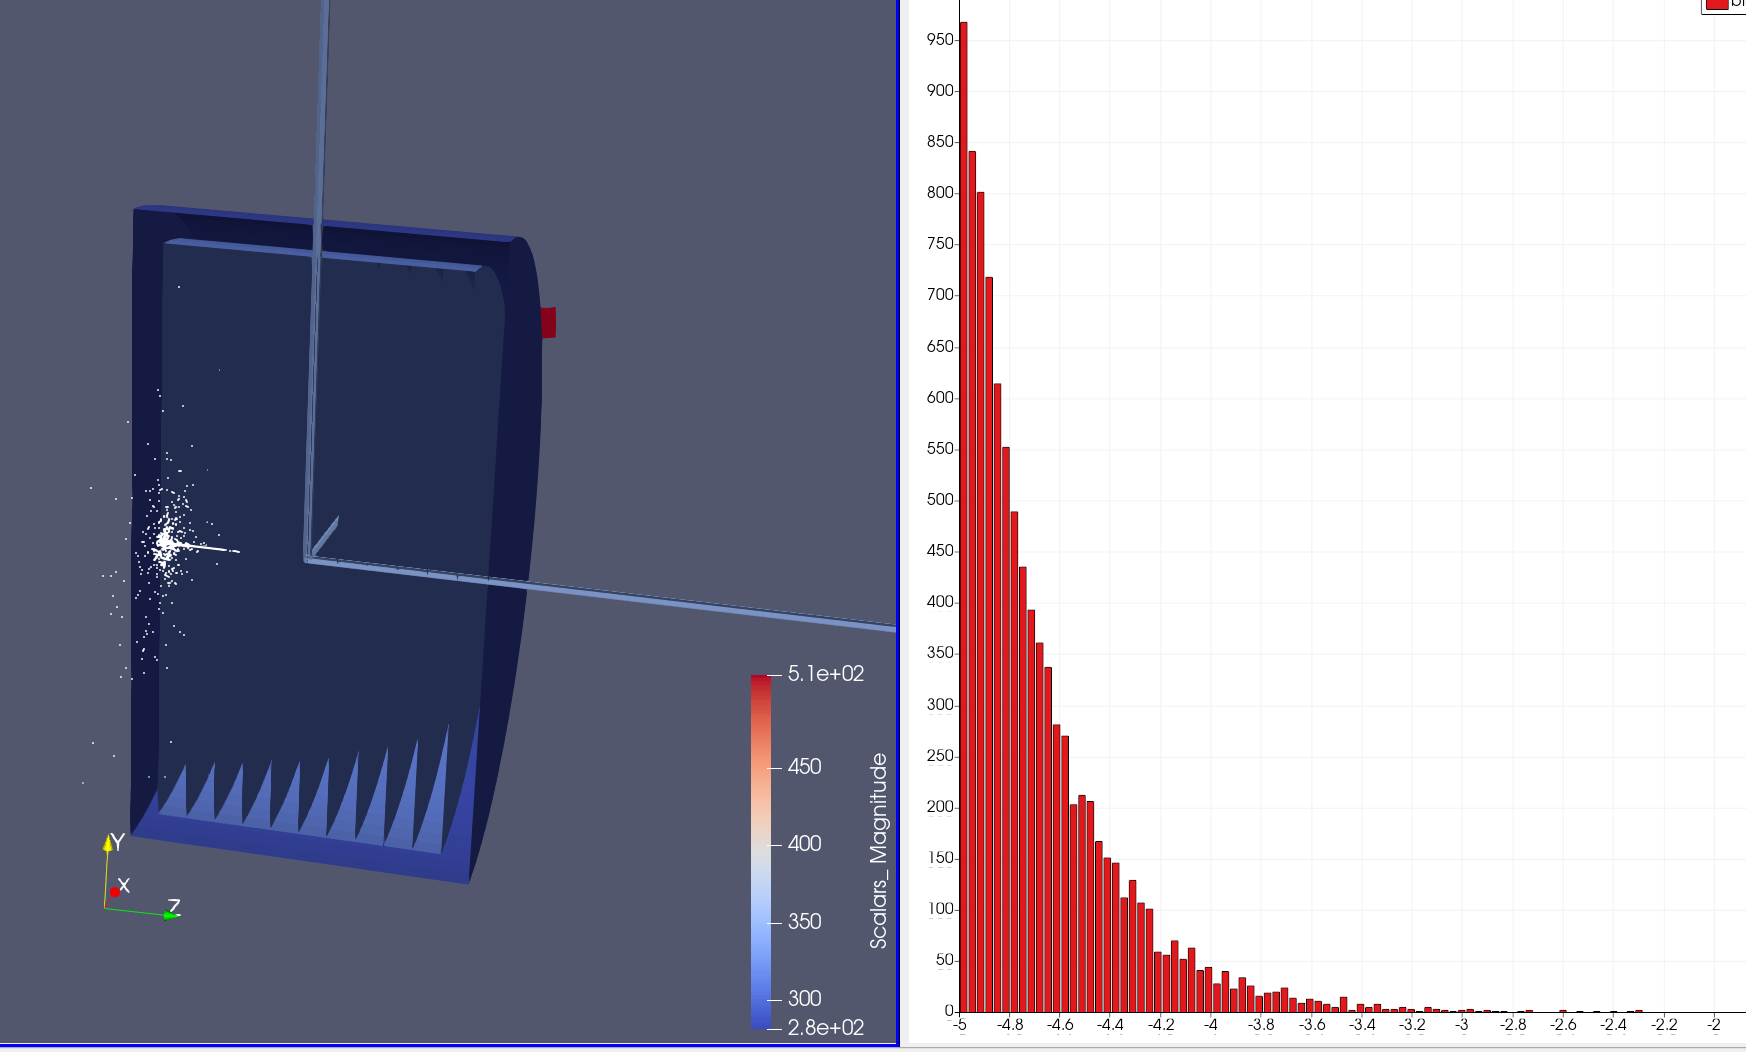
I use table to points and visualise succesfully. I plot a histogram fine as well. But I would like to create a heatmap similar to the delaunay3d filter but due to the low number of points it doesn’t work.
Do you have a reccomendation to plot this data? Can you superimpose it as a heatmap on a second volume?
Many thanks
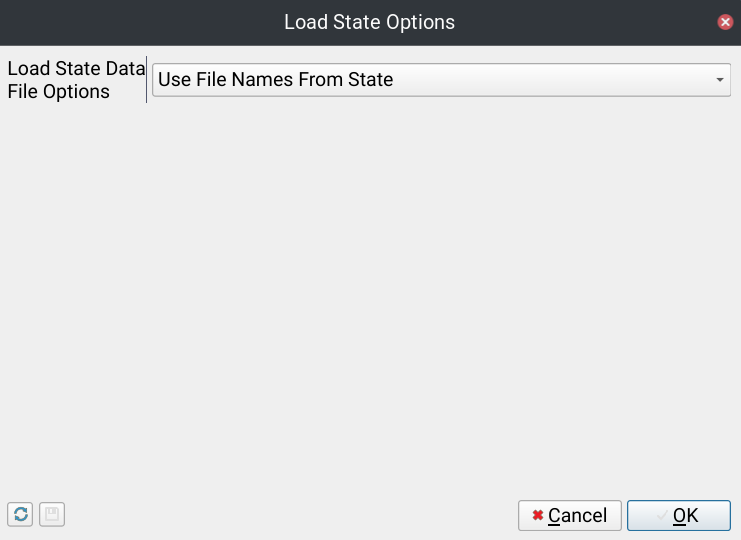
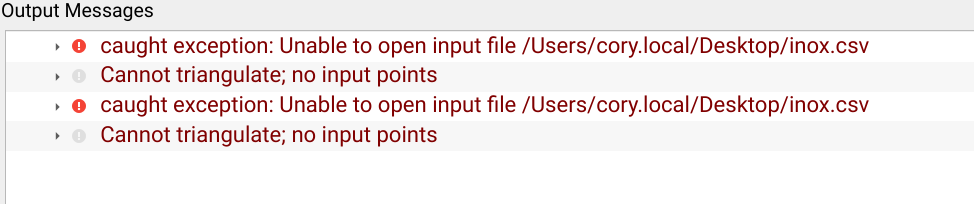
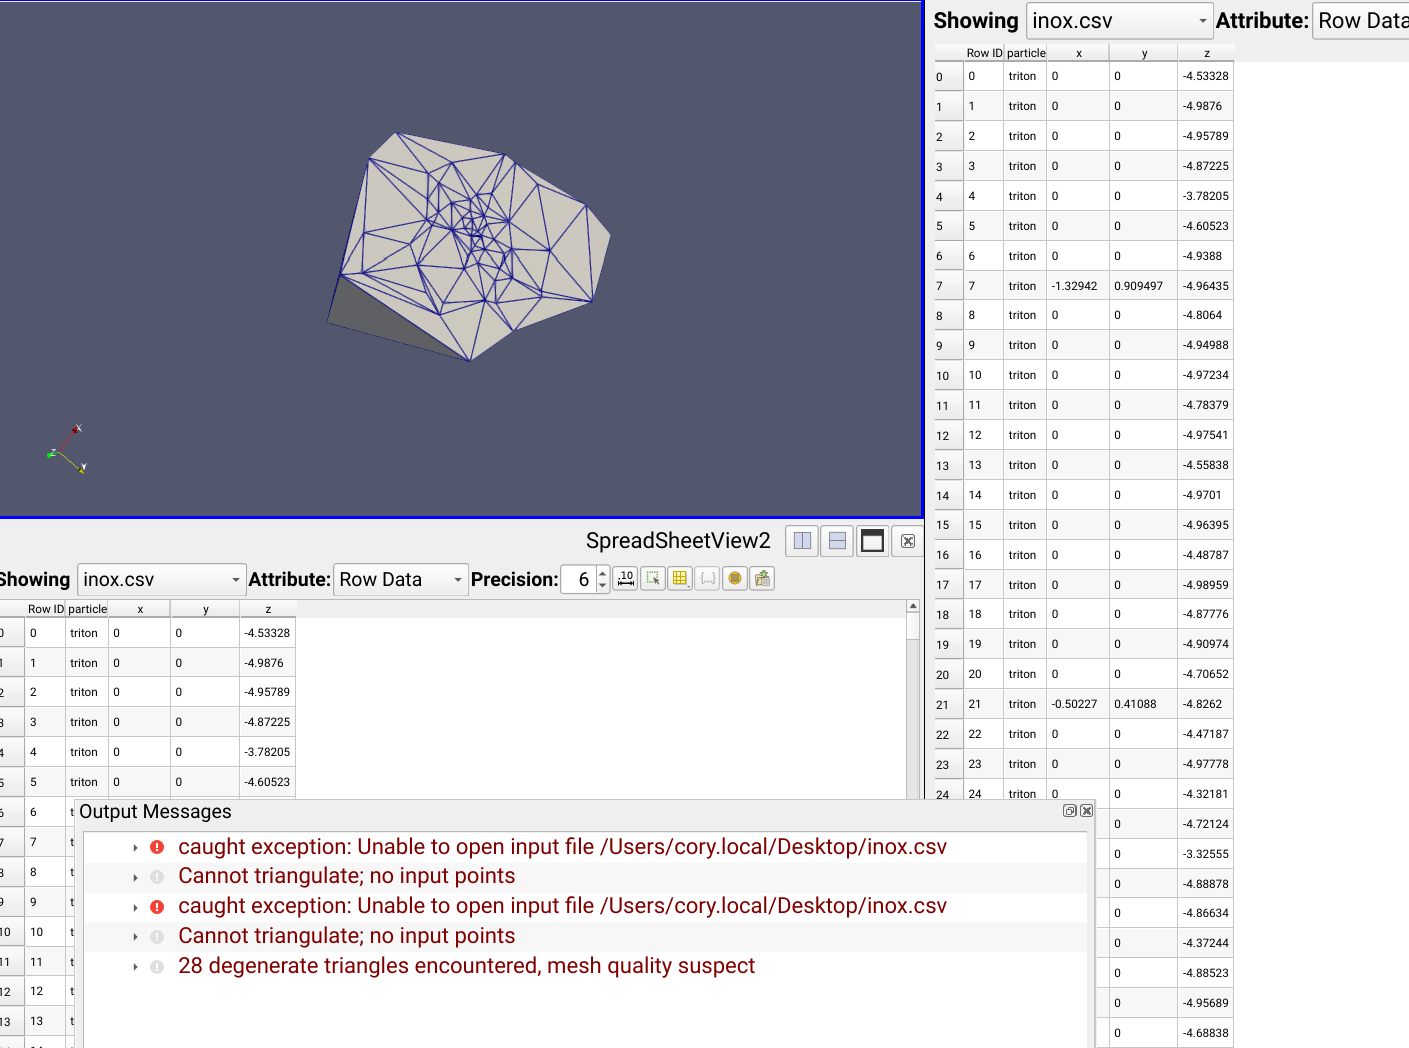
I’m not sure exactly what you are looking for. But you can map these columns to 3D points and apply Delaunay3D just fine. Please see the attached state file created with ParaView 5.13.0. inox.pvsm (318.4 KB)
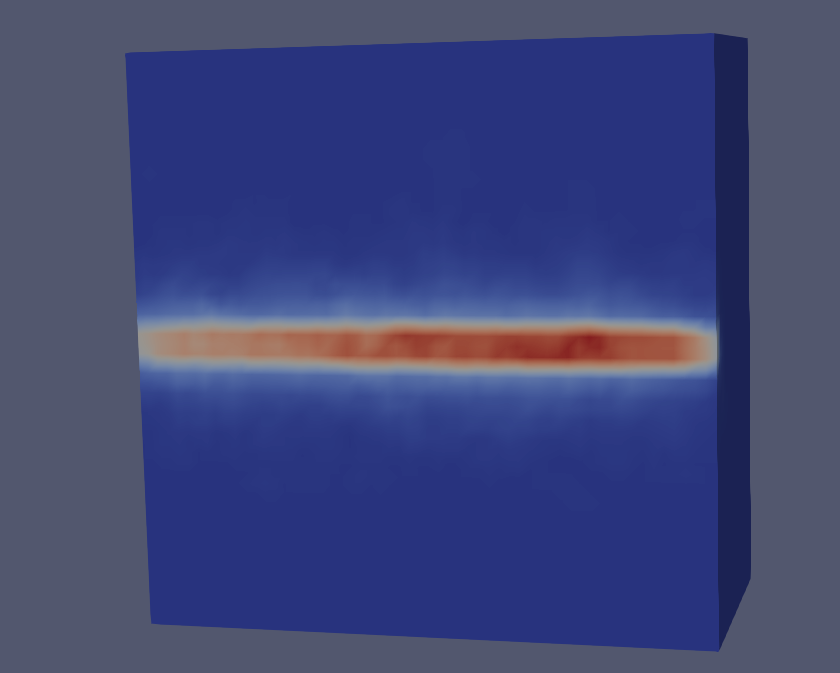
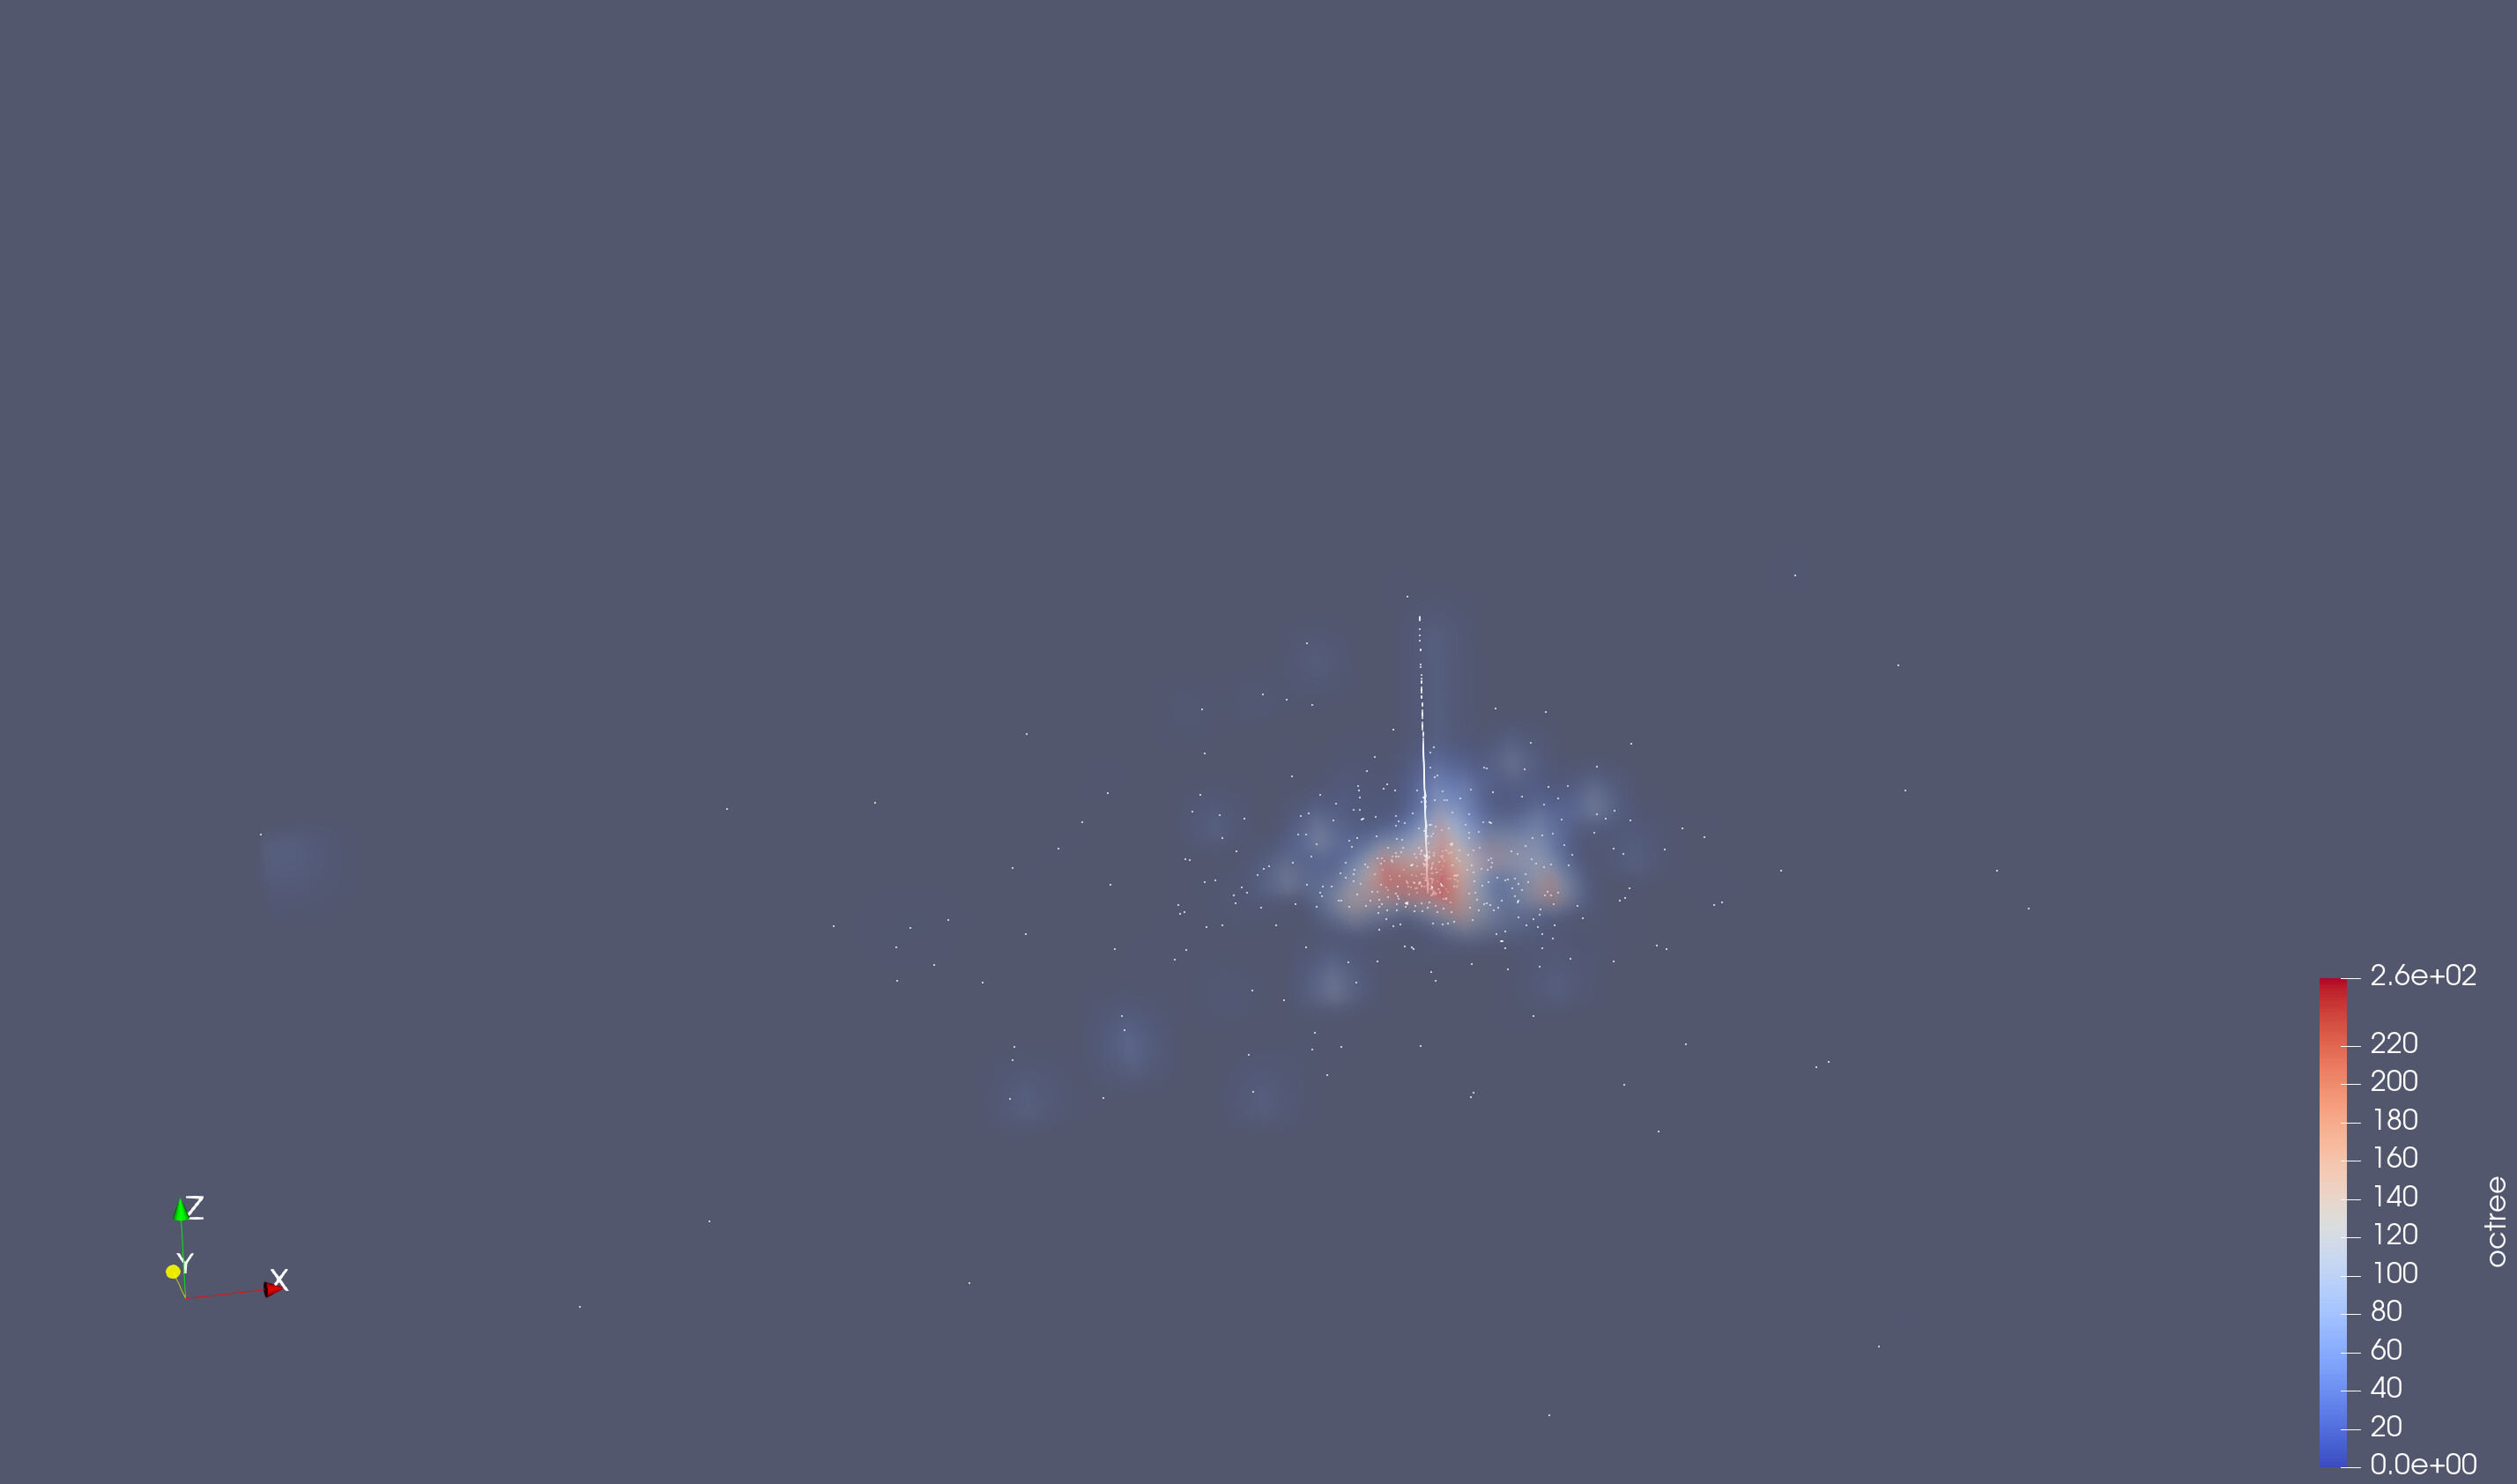
Apart from the mesh quality warning this isnt exactly what I want. I would like to get those coordinates resampled as a population in a wider space and then plot the delauney3d heat map from that.
which are coordinates of events im interested and somehow generate a similar heatmap as above. perhaps superimposed on to the volume in which this data originates.
Cheers. That’s quite nice. Thanks!
Is there perhaps a way to alter the range and size of the bins perhaps correlated to the volume of origin? Would I need to import that as a mesh of some kind?