Hello everyone,
I’m encountering an issue with the way ParaView displays mesh data in the spreadsheet view.
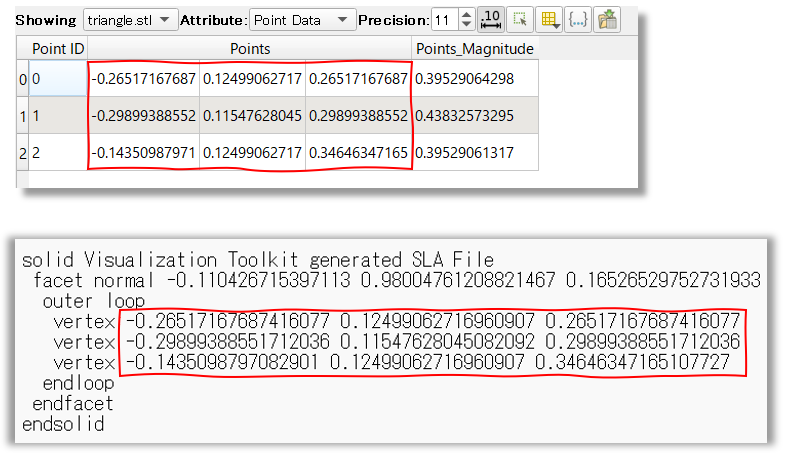
The data I am visualizing is stored in a STL file. From what I know, STL files describe every face of a surface mesh as a separate entry in the following scheme:
facet normal ni nj nk
    outer loop
        vertex v1x v1y v1z
        vertex v2x v2y v2z
        vertex v3x v3y v3z
    endloop
endfacet
i.e. a total of 12 components (or 4 3-components).
Paraview’s spreadsheet view, on the other hand, reduces this to 4 components (not counting the “Point ID”).
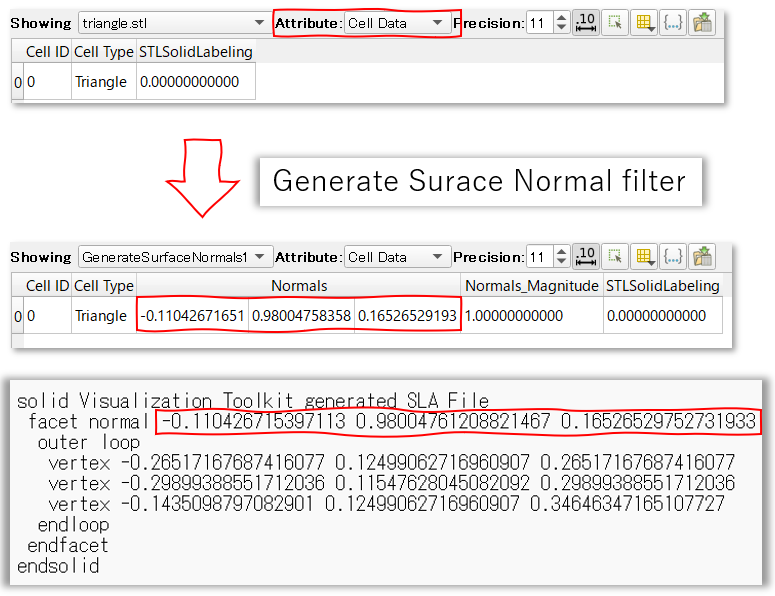
Can someone help me understand what is happening here ? Is Paraview’s spreadsheet view simply displaing every individual vertex ? (with duplicates ?)
Or is there something else going on ? Because there is another thing bothering me when using the “Cell Centers” filter: if Paraview’s spreadsheet view is simply displaying the vertices, then why is there more entries after using the “Cell Centers” filter instead of less ? (there should be 3 vertices per face => a 3-fold reduction of the spreadsheet size)
Please, can someone help me understand how Paraview and its spreadsheet view work with mesh data ?