Hi
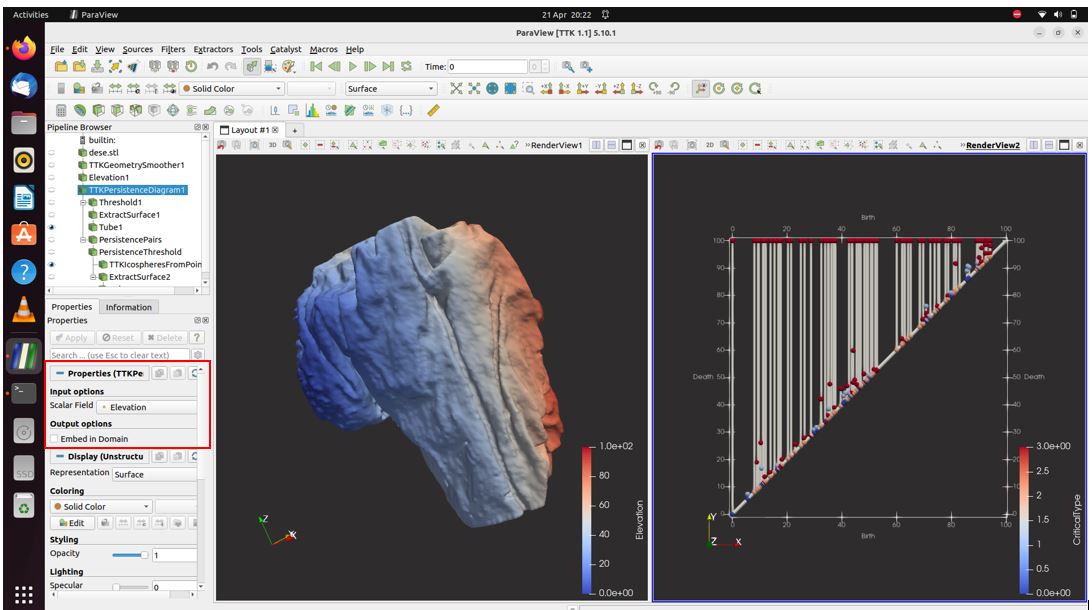
I have been executing the Betti numbers from Paraview, unfortunately, I missed the Debug level of PD under the Property section and I tried my best to restore it again but I can’t. How can I bring the debug level indicator back? Thanks
Hello @kokebdese
The terminal is the only place this information is displayed as far as I know.
You already found the Advanced properties toggle.
You can save the persistance diagram as any other data sets in ParaView:
- File > Save As…
- Press Ctrl-s
Then you can choose the format, .vtp for a vtk file format, .csv may be better if you want to compute some statistics outside of ParaView …
@Charles_Gueunet
Hi
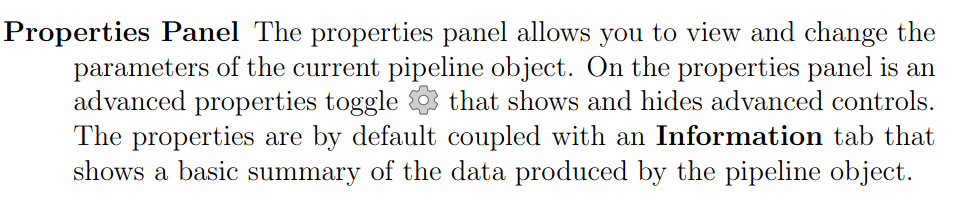
I have been checking for the Betti numbers for just a simple torus ~open inside (not solid one).
I expected the B2 (cavities: which I thought 2d holes) = 1. However, it displayed zero cavities. Is there something that I missed? Thank you.
torus2.stl (424.9 KB)
Looking at the code, the number of cavities is only updated for 3 dimensional meshes in the TTK packages. It seems wrong indeed, I started a discussion here.
Hi
When to expect the latest version of ParaView? ![]() Thanks!
Thanks!
@Charles_Gueunet
Hi
I thought I could able to see all the betti numbers on the PD (Persistence diagram). However, if you look at this figure, the number of handles(1D holes) are 10, but I can only see 2 in PD. What could be the reason? I want to see all of them in the PD. Thank you for your help.

@Charles_Gueunet
In case you need here is the data. Thanks
rect2.stl (788.4 KB)
Hello @kokebdese
Sorry for the late reply.
Previously, we where looking at the Betti numbers, which are only related to the geometry. The persistence diagram however make sense for a scalar field defined on a domain. It will track how the connected component of the scalar fields evolve as we sweep the scalar values. The full explanation would be available here.
Also, be careful, if visually this diagram seems to have 3 branches + the diagonal, it has 13 cells in the information tab on my side (it may be a bit different for you depending on the elevation you used). If you have watched the video, this is because the elevation may have induced very small features (noise).
In my case, by removing the pair with a very small persistence using a threshold, I could get the good result:
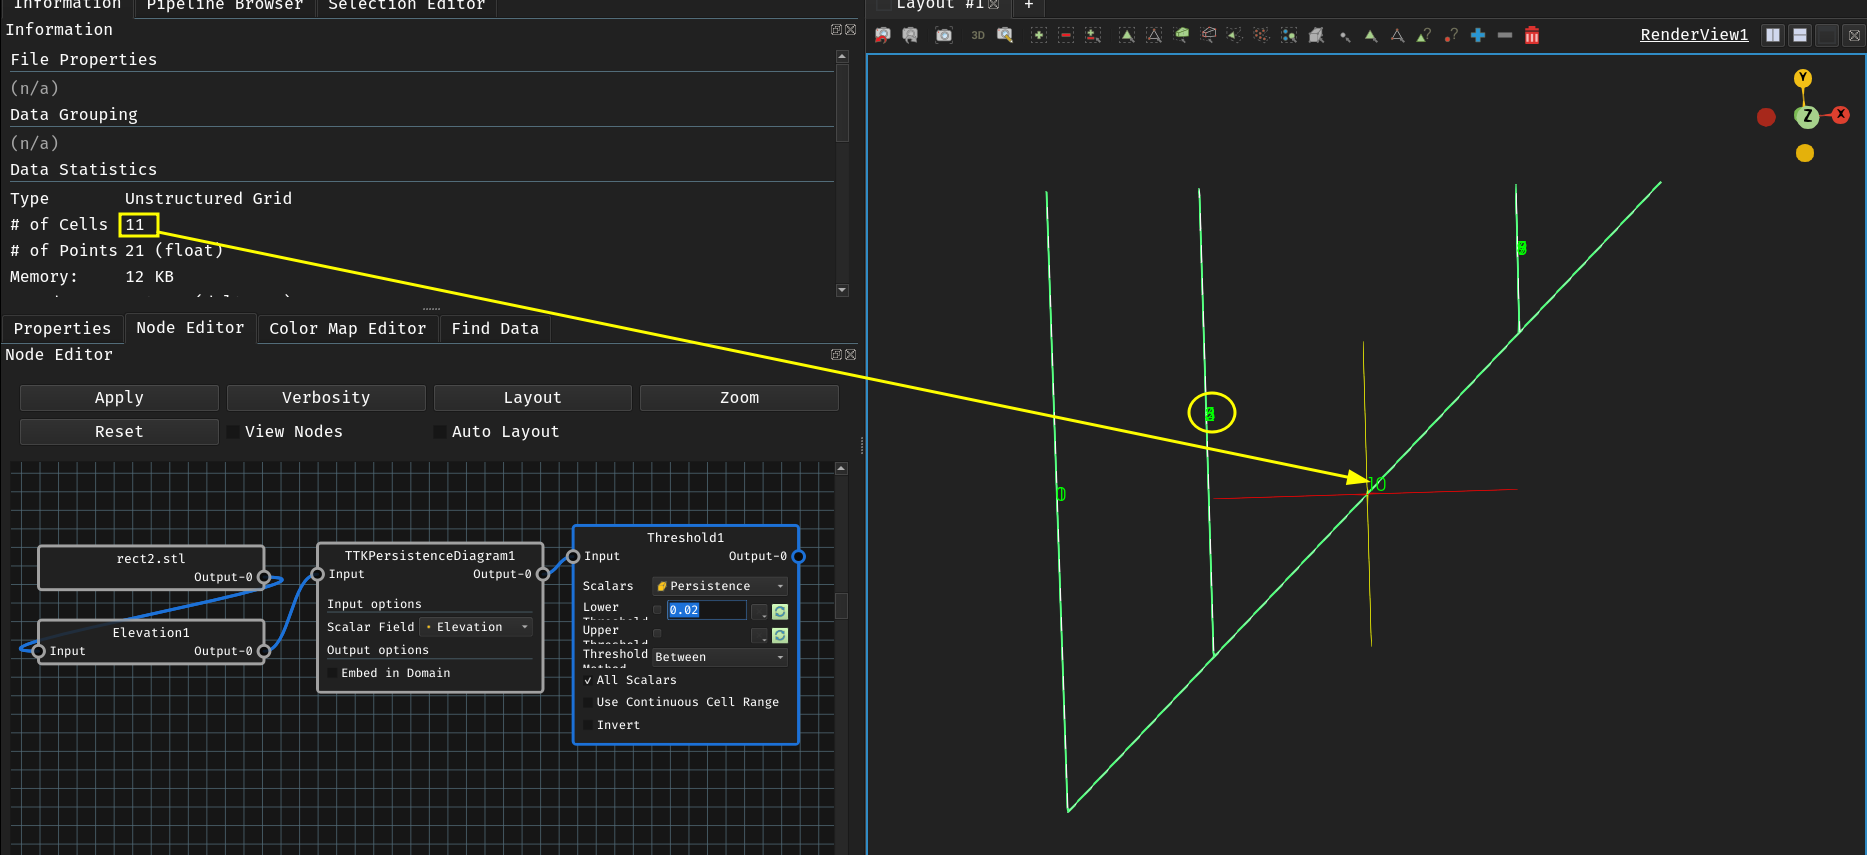
Ten pairs + the diagonal that correspond to the min-max feature.
This is definitely not the way to count topological holes.
You may want to try the persistence generator if you want to extract those holes, an example can be found here.
@Charles_Gueunet
Thanks!
Hi, could you shed some light on how the debugging actually calculates these Betti numbers? Is it by chance using the algorithms shown in the paper mentioned in TTK - the Topology ToolKit - Topological Data Analysis and Visualization?
It is using the same geometric properties to reduce the computation, like the Euler characteristics.
The Betti number are extracted after a Discrete Morse Sandwich execution which is different from the Union Find (Merge Tree) approach described in the paper. So in short, same tricks, same results, but slightly different approach.
Do you happen to have a reference to the algorithm or a particular paper detailing the mathematics behind it?
Hi @Charles_Gueunet,
This is probably quite late from when the original post was put up, but I have tried following your steps but I cant seem to view the results. How do I get access to the terminal output? I have extracted the mesh surface and triangulated it as well as set-up the Persistance diagram but I just don’t know how to access the logs in Paraview and there doesn’t seem to be a lot of info out there regarding this.
Best regards.
Hello @Ivan_B_G
You need to start paraview from a terminal to see those logs (on linux / mac)
If you are on windows, you can:
- use git bash, or
- redirect the log to a file with:
paraview -l=messages.log
Hope that helps,
Charles
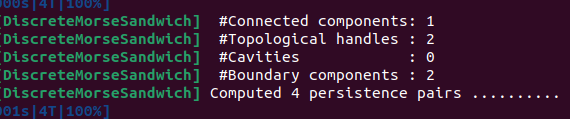
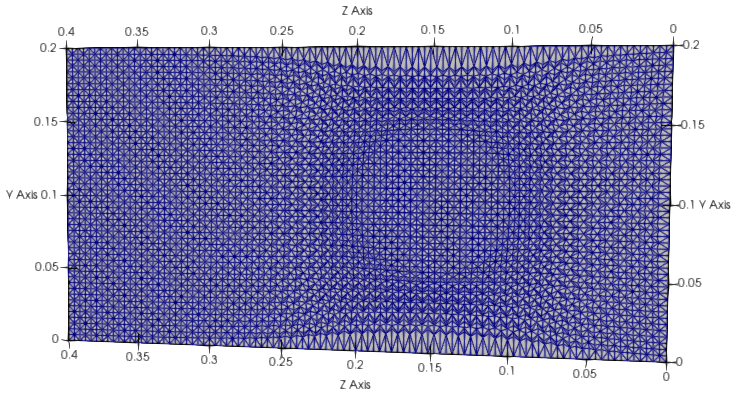
Thank you for the response! I have launched paraview from terminal and got the following results for a mesh that deforms to obtain the surface mesh of a sphere (3D but I have attached a slice view).
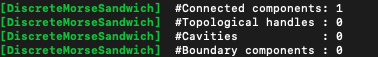
What I am wondering is why the “Boundary components” is equal to 0. Would you happen to have any idea?
Best regards and thank you in advance,
Ivan
Hello @Ivan_B_G ,
Boundary components are related to the resistance diagram computation.
If I remember well, this number describes the number of un-closed pairs, phenomenon which can occurs on periodic meshes for example (where the left boundary is virtually stitched to the right one, the top boundary corresponds to the bottom one… and so forth).
To make it short, this is not related to the Betti numbers per sei, and should not occurs in usual 3D meshes.