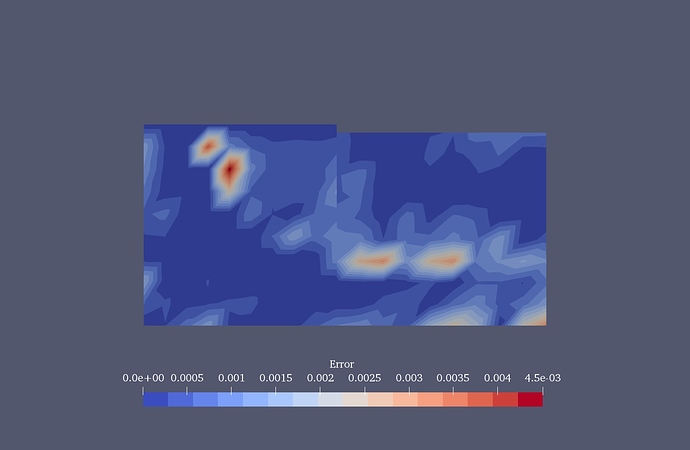
I did a 2-D contour plot of point data which has small numbers. I expected a exponential annotation in the colour bar. Instead I get the last value (which is the largest) in exponential form but the others in decimal form. Can I fix this ?
Yes, you can change the formatting of both the tick labels (the intermediate labels) and range labels (the ones on either end). Open up the Color Map Editor (View -> Color Map Editor menu item) and click the ![]() icon top open the Edit Color Legend Properties dialog. Click the gear icon in the upper right to show the advanced options. Uncheck the Automatic Label Format setting and change the Label Format setting to “%-#6.1e”. That will give you scientific notation for the intermediate tick labels.
icon top open the Edit Color Legend Properties dialog. Click the gear icon in the upper right to show the advanced options. Uncheck the Automatic Label Format setting and change the Label Format setting to “%-#6.1e”. That will give you scientific notation for the intermediate tick labels.
Thank you
Can you edit the number of Label displayed ? here you have 10 displayed label , Can you change it to 5 or 7 ?
Yes, but not with the automatic labels. You must enable and enter custom label values.
