Hello,
I am a novice at Paraview. I have a data file in Tecplot format at which I am struggling to plot streamlines. The Stream Tracer is actually grayed out.
Any help is appreciated!
Thanksextrafine_res_501.dat (139.4 KB)
Welcome to the ParaView Discourse forum, M P.
Without looking at your dataset, my guess is your data has only cell data, and Stream Tracer works only with point data. Please apply a Cell Data to Point Data filter first. Then the Stream Tracer should be available.
Thank you Cory for the response. I just checked out and found that the Cell Data to Point Data filter is grayed out too! I guess I am doing some basic mistakes?!
Okay. I looked at your data file, and you have point-centered data, so I was wrong about Cell Data to Point Data being needed (and also explains why that filter is grayed out). The problem is that you don’t have any vector fields, which the Stream Tracer needs. To create a vector field, add a Python Calculator filter, and set the Expression to make_vector(U, V). You can change the Array Name property as well to whatever makes sense to you. Once that is done, you can apply a Stream Tracer.
Reduce the number of streamlines by reducing the Resolution from 1000 to 10 or so. That should give you what you are looking for.
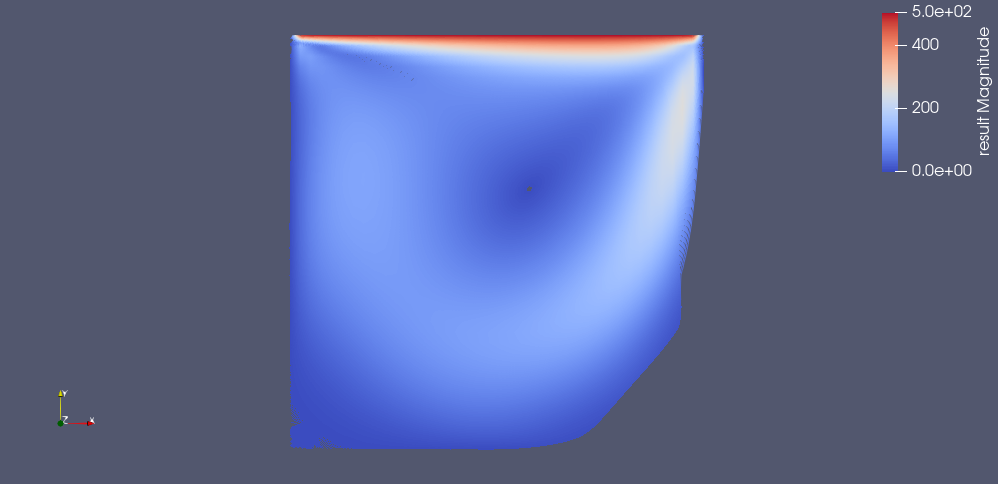
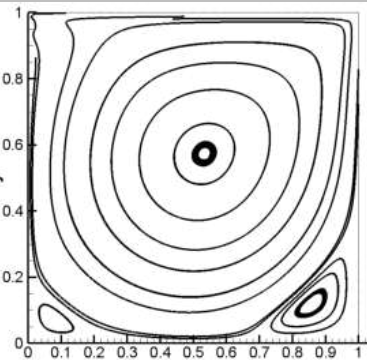
Thanks for the instruction. I reduced the resolution but the streamlines are not continuous and so I never could get something similar to the picture I sent (also the vortex on down right are not appearing).
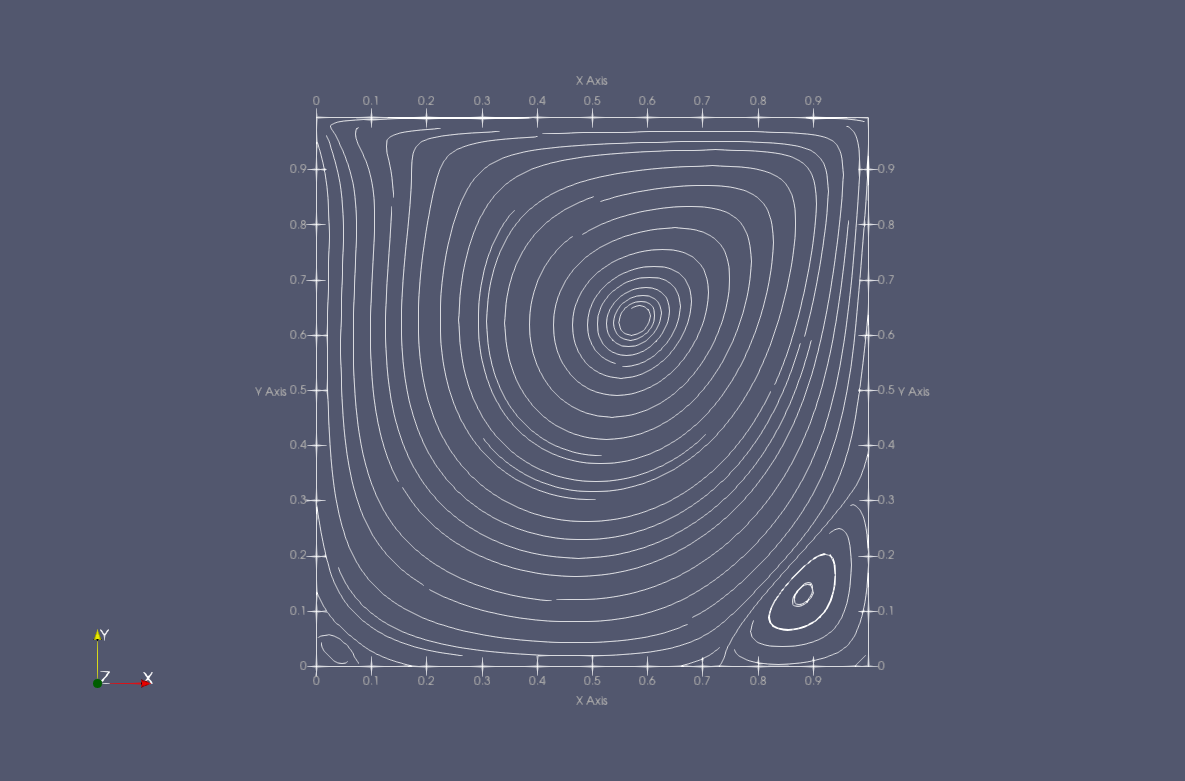
For 2D data you can also use EvenlySpacedStreamlines2D. Attached is the state file and the image I got with that filter.
streamlines.pvsm (350 KB)
Thank you Dan, great instruction!
Hi Cory
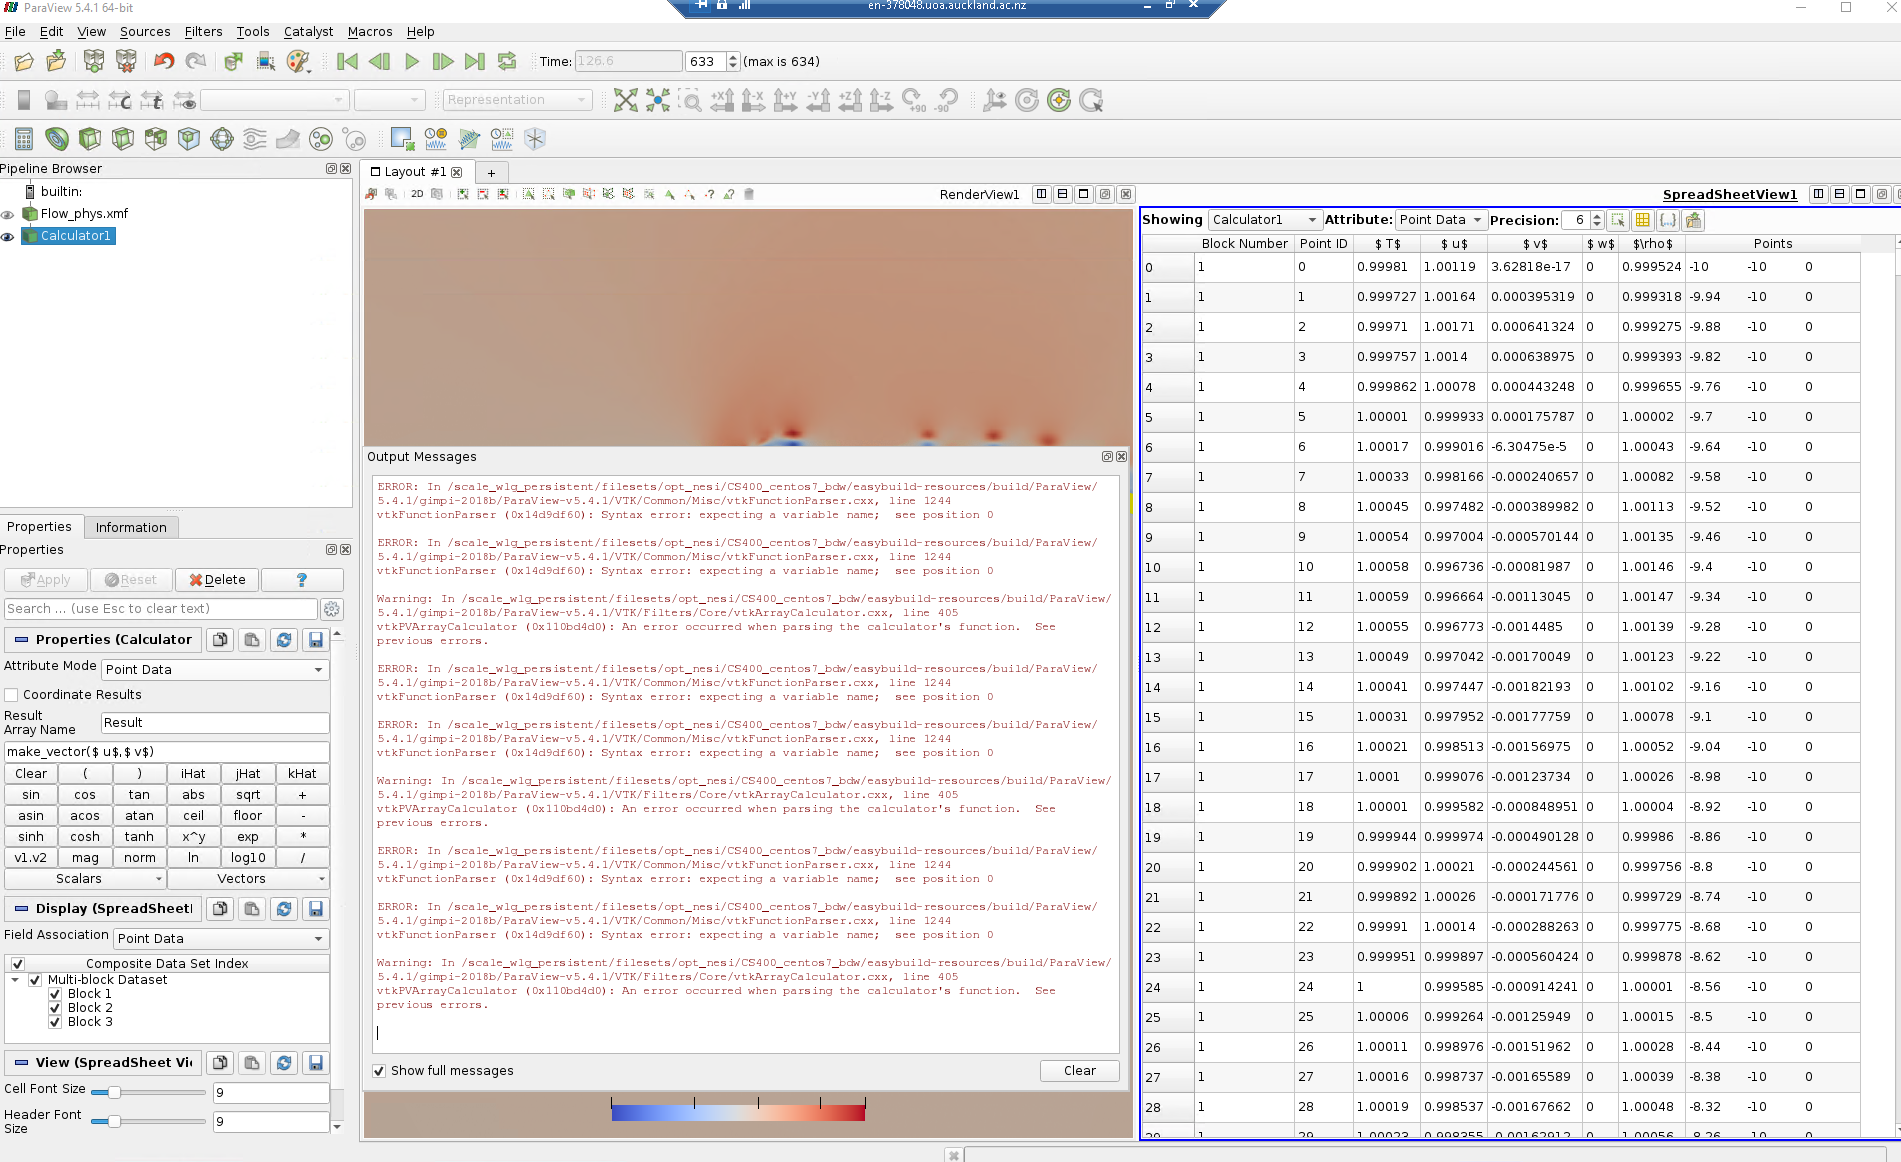
I have the same problem and my data are saved as point data without cell data. I have tried to use the calculator expression make_vector(u,v), but an error was generated. How the expression is written in the calculator? I have also the velocity magnitude component in x,y,z
I have attached image for the error generated

I think the “make_vector” function is only available in the latest version (5.10 ?)
for 5.4, you should use uiHat+vjHat
As stated, the Merge Vector Component filter is new to 5.10.0-RC1. The functionality is in the calculator. This is explained in the Users Guide. The formula is xComponentiHat+yComponentjHat+zComponent*kHat.
To clarify, Merge Vector Components is an independent filter (not related to any Calculator filter) that enables creation of vector arrays from individual arrays.
make_vector is a Python function available in the Python Calculator that can be used to do the same. See 5. Filtering Data — ParaView Documentation 5.11.0 documentation for details. It has been around for a while (I’m not sure how many versions ago).
As Alan alluded to, you can also use the Calculator filter with the expression xComponent*iHat+yComponent*jHat+zComponent*kHat where xComponent, yComponent, and zComponent are the names of your component arrays.