Dear all,
I am using PV 5.10.1, on Linux.
I am trying to draw streamlines, from a non standard source, for wind field. I would appreciate some help or suggestions, as I am failing to persuade PV to actually draw the lines along with terrain (and other data).
With “non standard source”, I mean that the 3 vector components (u,v,w, here named ua, va, omega) are given as separate scalar variables (time, level, lon, lat). Their properties are:
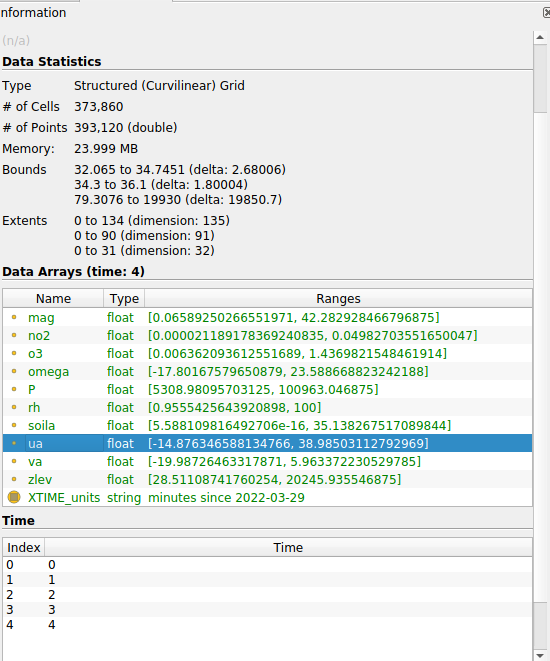
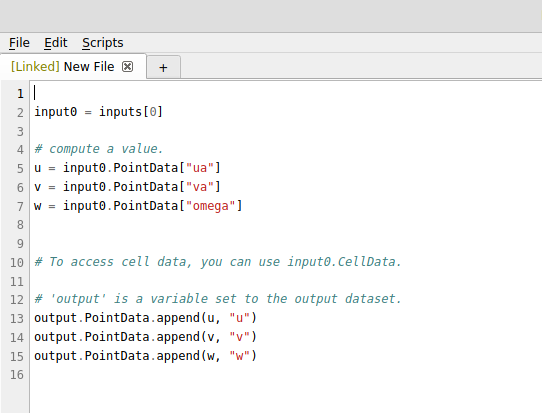
So far, and also in the attempt to individually manipulate each component separately, I have used a programmable filter to extract those 3 components:
My data come from a numerical model, the results of which I am regrinding (separately, outside PV) and importing to do nice-looking visualization.
Question:
Now, in the workflow described above, what is the syntax to have streamlines appearing in my animation? How can I achieve drawing streamlines, i.e. what data type should my separate components be, to be plotted and visualized?
Remarks:
I tried “playing around” with the available test datasets (the cylinder and its flow) and I see that velocity (“v”) has all the components ‘nested’ inside the same variable. That might depend, I suspect, from the variable type (I think I have understood it must be a polymesh?)
And also: once my first goal is achieved, can I animate using SURFACE-LIC to have a tracer-like particle moving along the streamline(s)?
Thank you so much for any comment or suggestion you might want to share with me.
Marco