Hi Everyone, I am facing a problem that I couldn’t solve by myself or any support around internet.
I have tried to draw isolines over a vector field but I cannot do it. I explain my process, I am missing something, but I cannot figure it out.
I have an output -ASCII- 4 column file. x, y, vx, vy, which represents the position and the x and y components of a vector field (Magnetically Induced Current Density *.vector) obtained with DIRAC code.
01.vector (886.6 KB)
I am doing the following (1st way):
-
I load the file using CSV reader indicating that the space delimiter is a blank space as well as no header. x, y, vx, vy, is loaded as field 0, 1, 2, and 3, respectively,
-
I transform with Table to Points the field 0 and 1 as x and y column indicating that these are only 2D points.
-
I use calculator to compute the magnitud of the vectors sqrt(vx^2+vy^2)
-
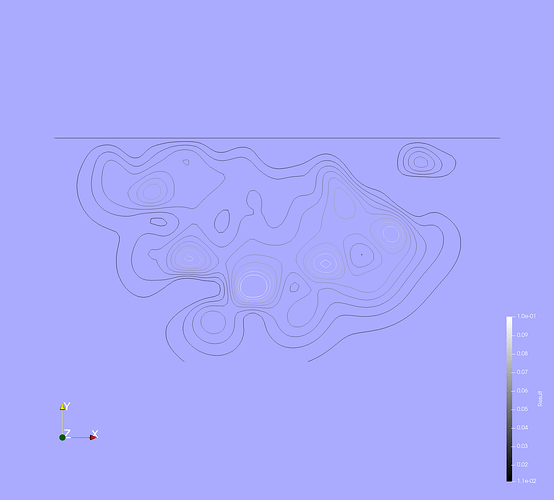
I generate “isolines” adding a range of values between 0 and 1.46 (according to my value range), linearly with 10 samples.
Once y click on “Apply”, the spreadsheet becomes blank and nothing appears in render view.
I Tried a different way:
-
I use calculator to compute the vector field as ihatux + jhatuy
-
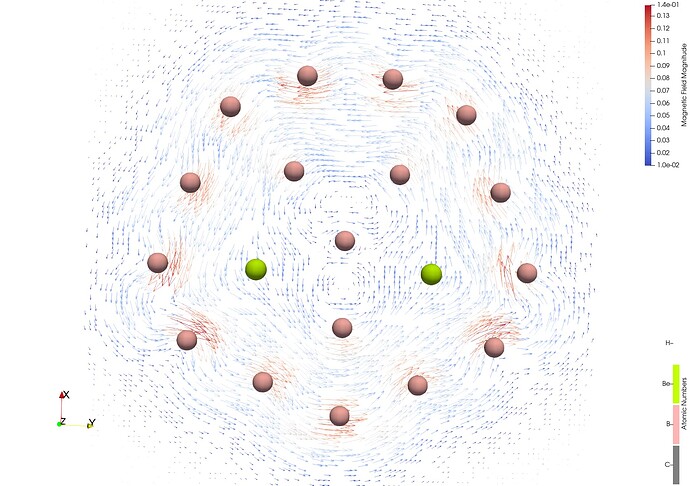
I use the Glyph representation orienting and scaling by my magnetic field (equation in 3rd step)
-
I Integrate the stream lines with the options by default but there are no isolines.
I don’t know if I am missing some steps.
I appreciate any help that you could provide. Thank you so much.
PS.
I also tried from the calculator filter by evenly spaced streamlines 2D
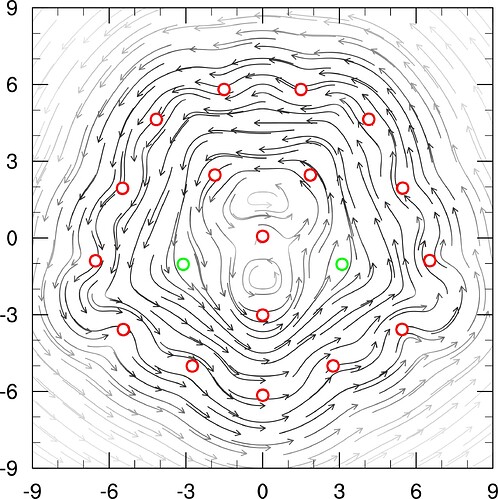
I am attacing the paraview images (with glyph but no isolines) as well as a plot done using a PynGl code that I have. My objective is to extend it to a 3D plot, but I am still facing the same problem.


