I have a simple flow configuration of a vortex in a pipe which I performed using the Code_Saturne software.
Now I want to visualize using ParaVIEW the tangential and radial components of the velocity but I find some difficulties.
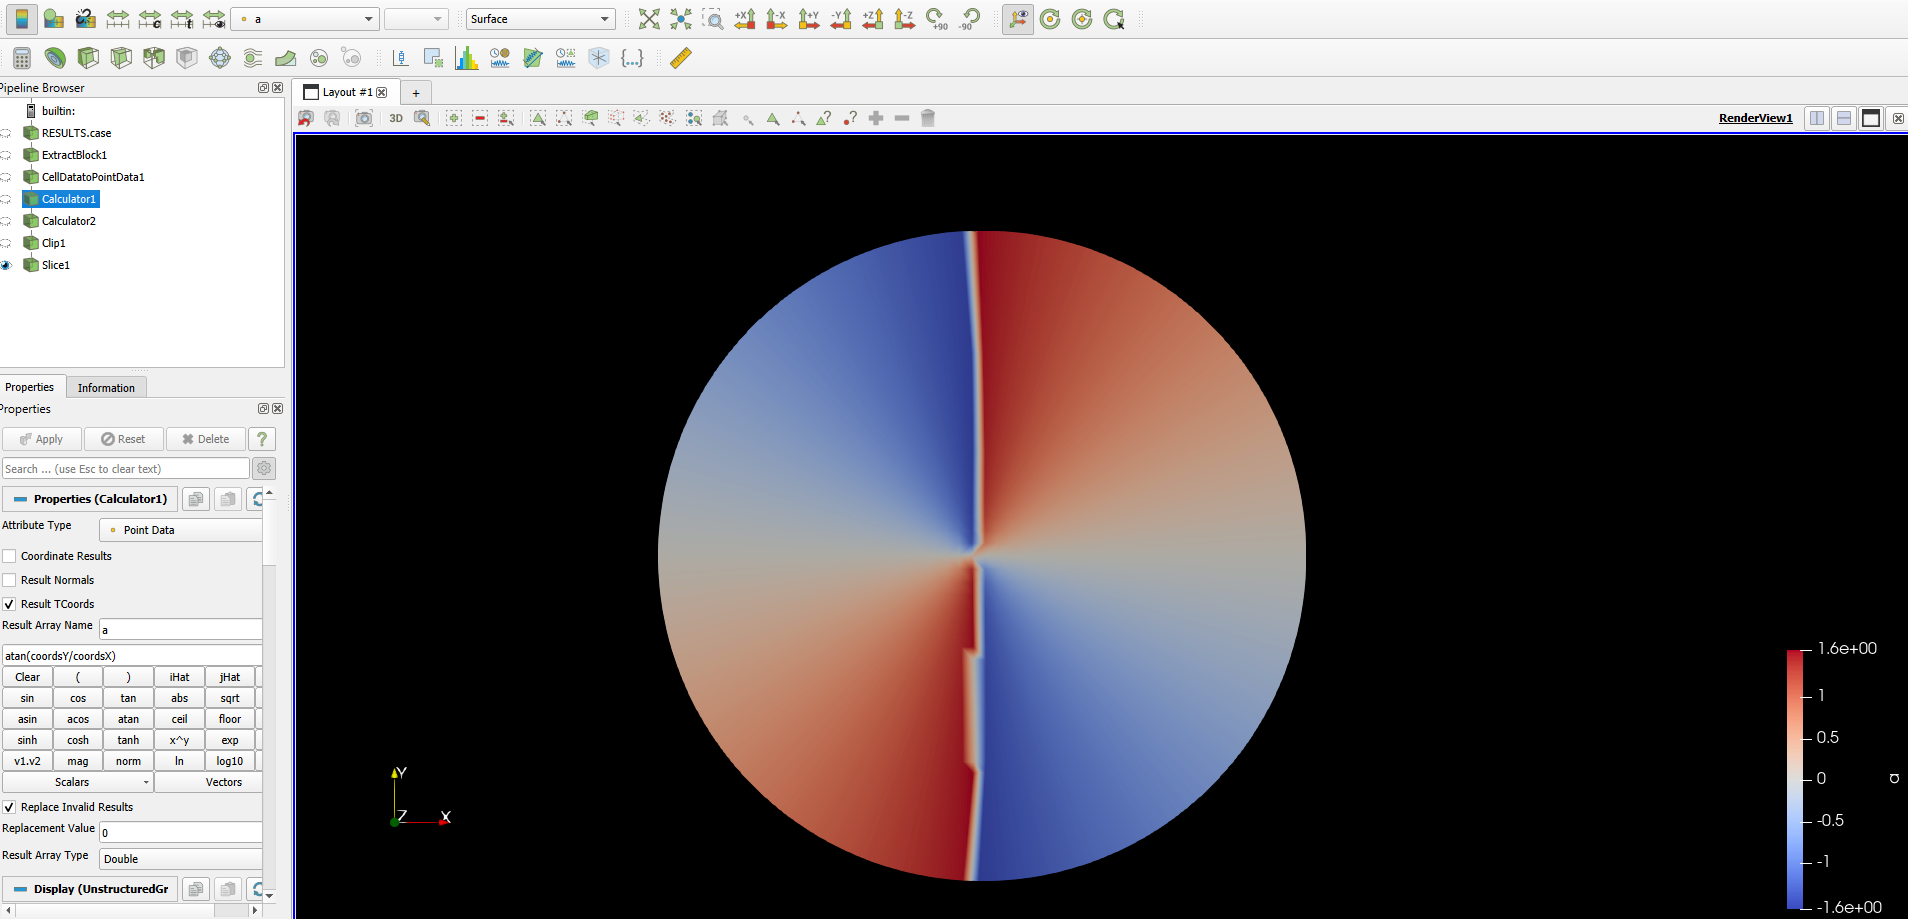
Knowing that Z is the axial direction, I calculate the angle a=atan(Y/X) using the calculator filter as:
atan(coordsY/coordsX)
Further, I use again the calculator filter to get the tangential velocity using the relation:
Vtan=Velocity_Y * cos(a)-Velocity_x * sin(a)
When I calculate the angle a I get some strange results, maybe due to the fac that at some points it meets the coordinate X=0.
Could you please tell me how should I handle this problem? I also attach a picture with a angle visualized on a slice perpendicular to the flow axis.
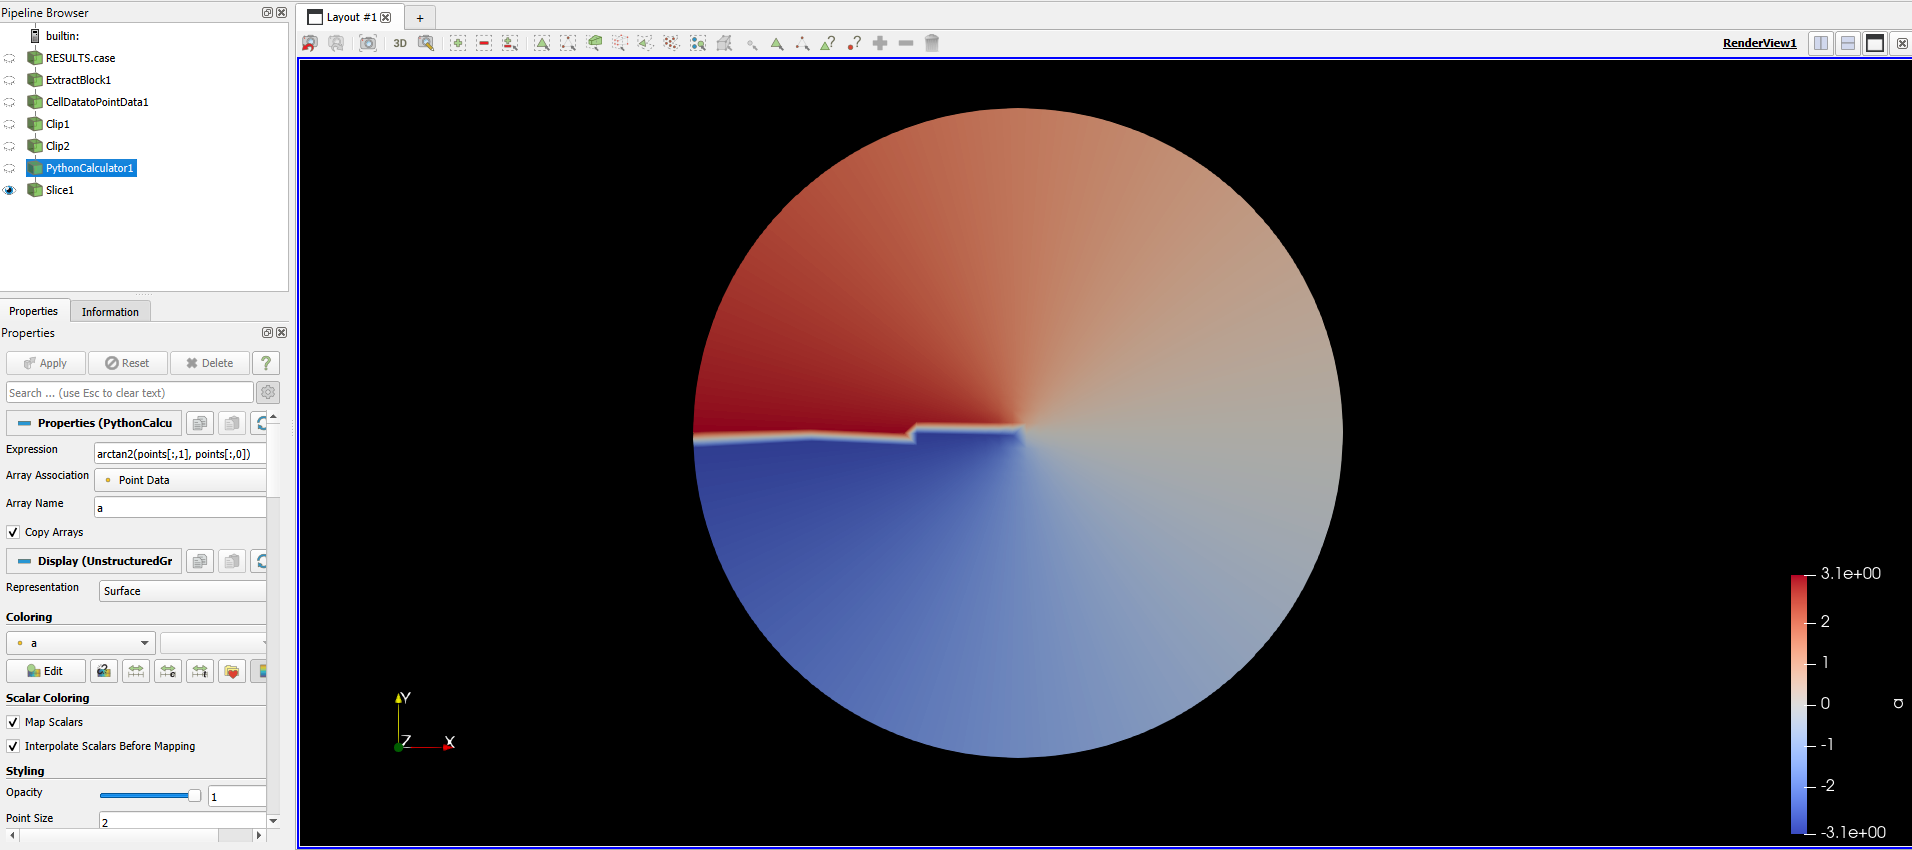
To avoid zero division in the calculation of angle a, instead of using the Calculator filter, you can use the Python Calculator, which allows you to use numpy’s arctan2(). That is, it would be possible to write
Thank you for the interest in my problem. I applied you suggestion at the problem is partial solved, see the attached figure. Should I do something more?
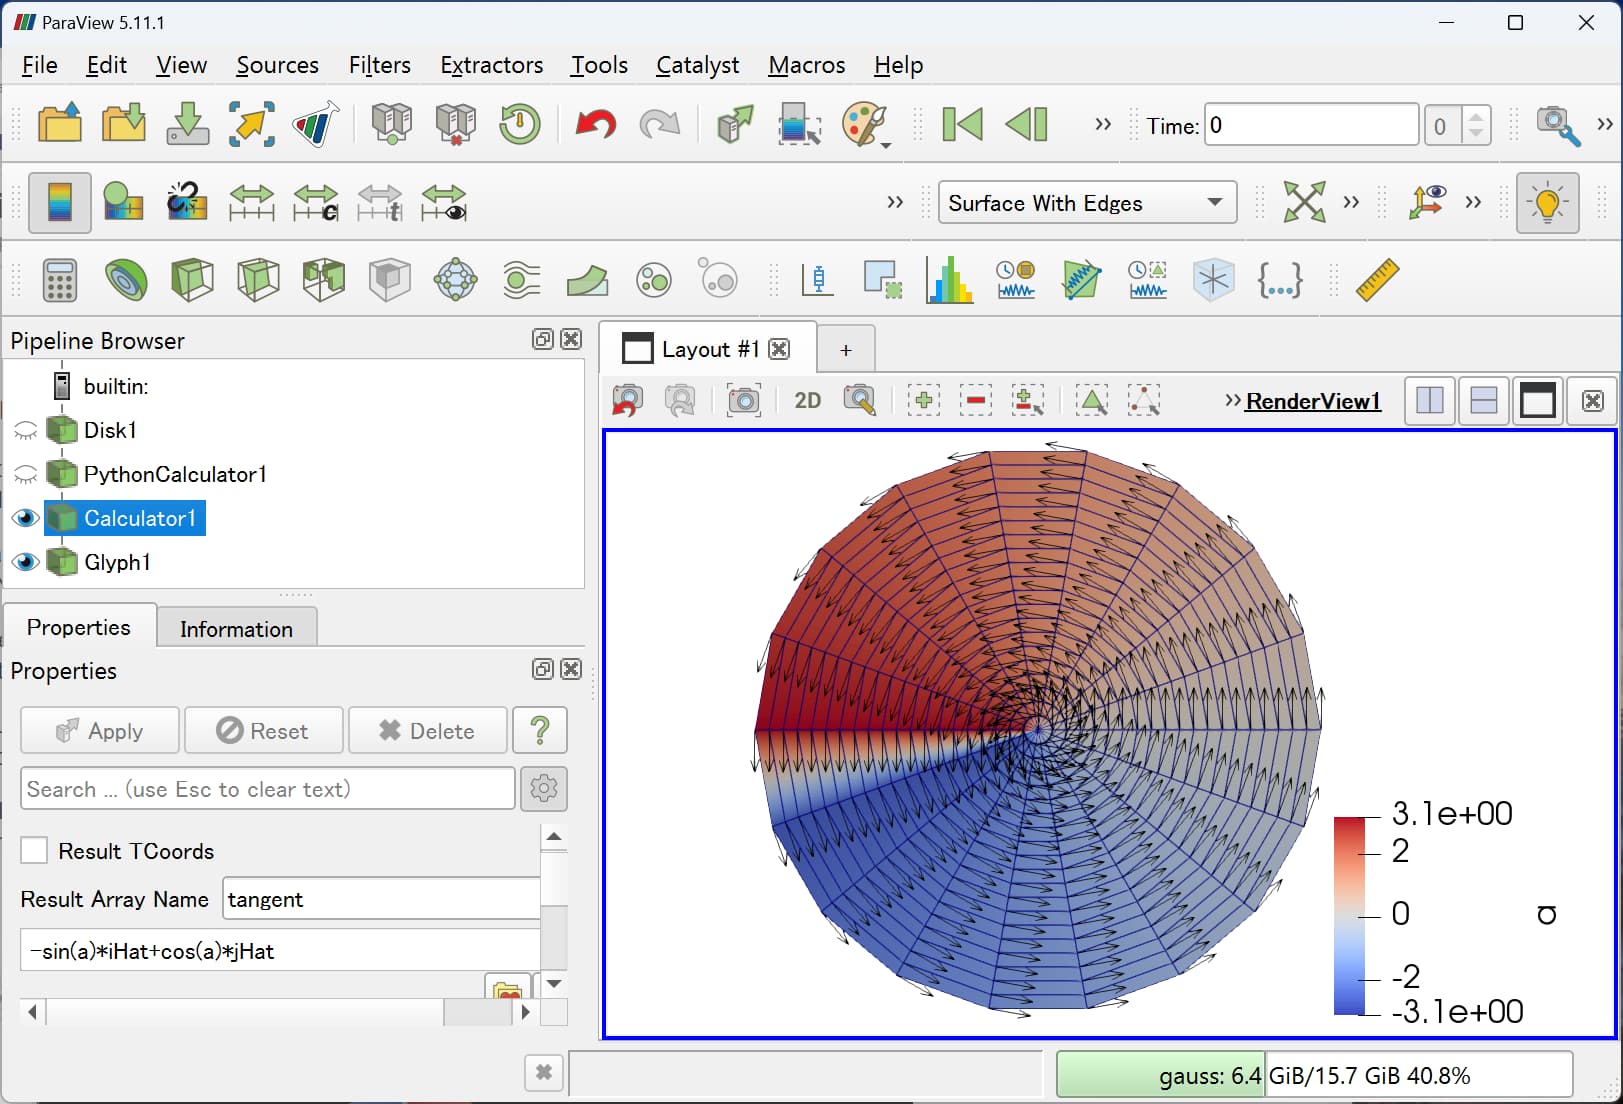
Since the function arctan() is a multivalued function, one rotation should always result in a discontinuity at a certain angle. On the other hand, for tangent vectors, as shown in the figure below, no problem arises. Therefore, the inner product of the velocity vector and tangent vector should be calculated correctly. (The same goes for the radial vector.)
I hope this is helpful.
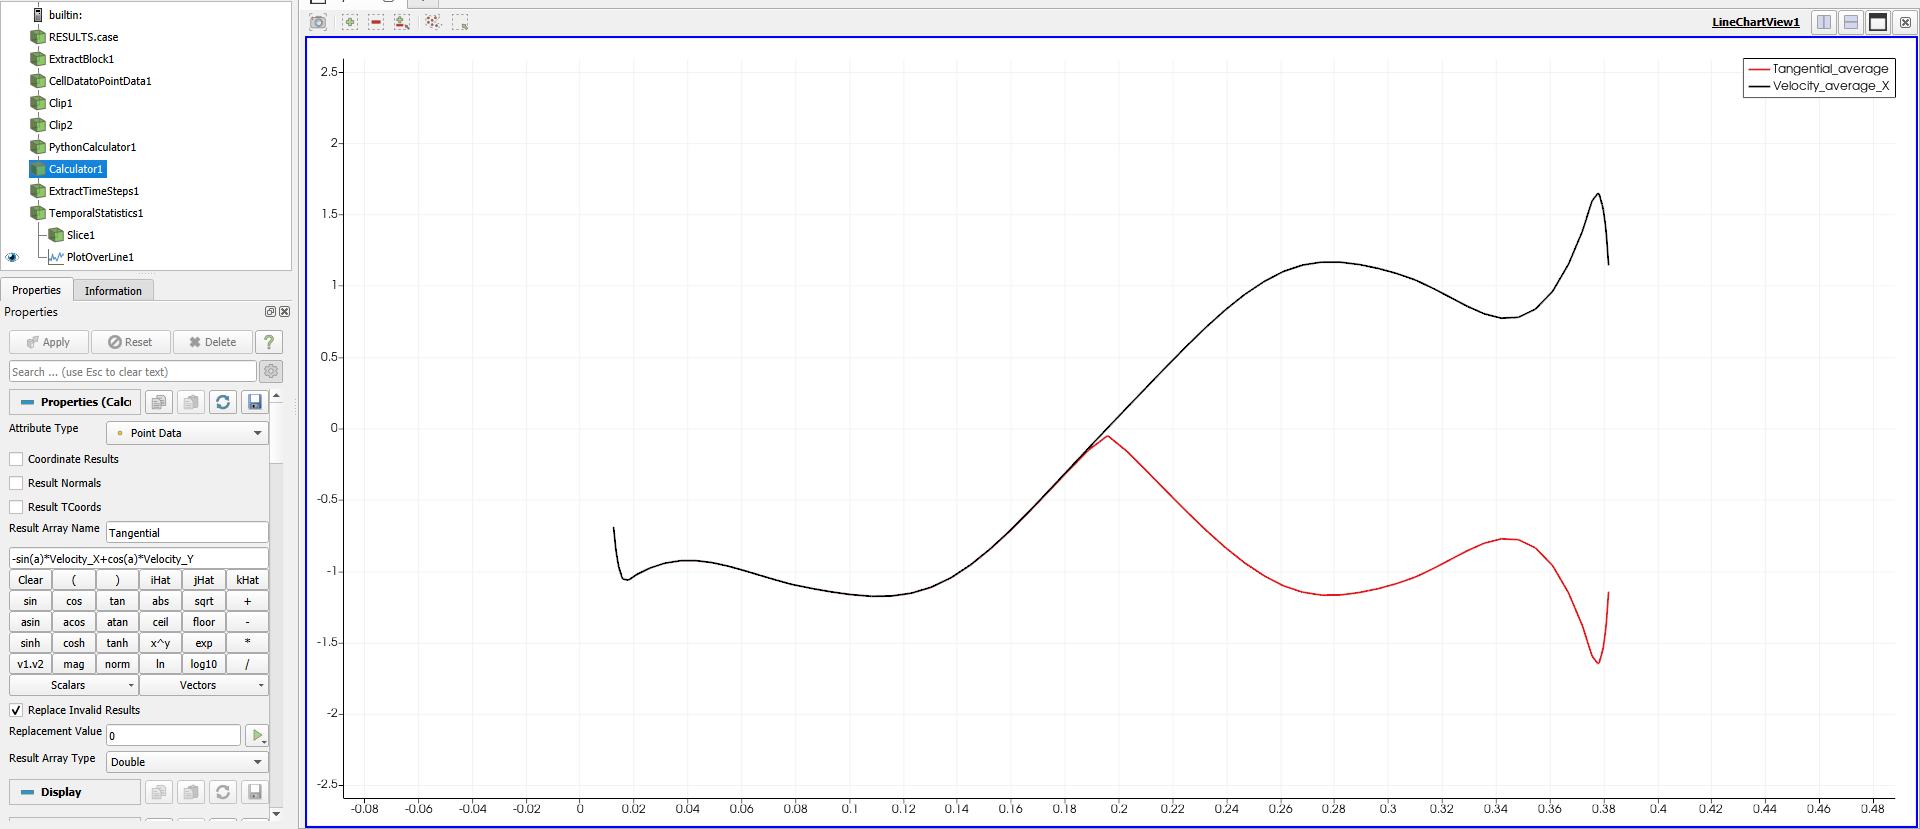
I would have one more question if possible. Now that I got the tangential and radial velocities I have to time average them.
So, I used the following steps:
From Filter->Temporal->Extract Time Steps, I selected the wanted time (in my case, there is a swirl in a pipe so I extracted the time steps according to a rotation of the swirl);
I applied to the previous filter a new filter Temporal->Temporal Statistics and computed the average values.
Is there another way to time-average the values? I have some reference velocities and the results are quite different as you can see attached.
Regards,
Robert
Sorry, but I am not familiar with how to assess the swirl flow, is it unusual for Tangential_average to be all negative?
Is the horizontal axis of the PlotOverLine1 graph a line along the y-axis? If so, it seems reasonable that the tangential component would be negative if the swirl flow is clockwise.
@Kenneth_Moreland Since you seem to be familiar with the fluid analysis, would you be able to take a look at it, if possible?