I have a question that is about post-processing using Paraview to extract time-averaged values.
For my simulations (using simvascular) of flow in the human aorta, I am currently calculating the instantaneous wall shear stress (WSS) values at the surface of the geometry.
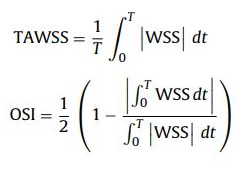
Now, additionally, I would like to calculate the time-averaged wall shear stress and the oscillating shear index.
My WSS values for every timestep are saved to a time-series .vtp and .vtu format file
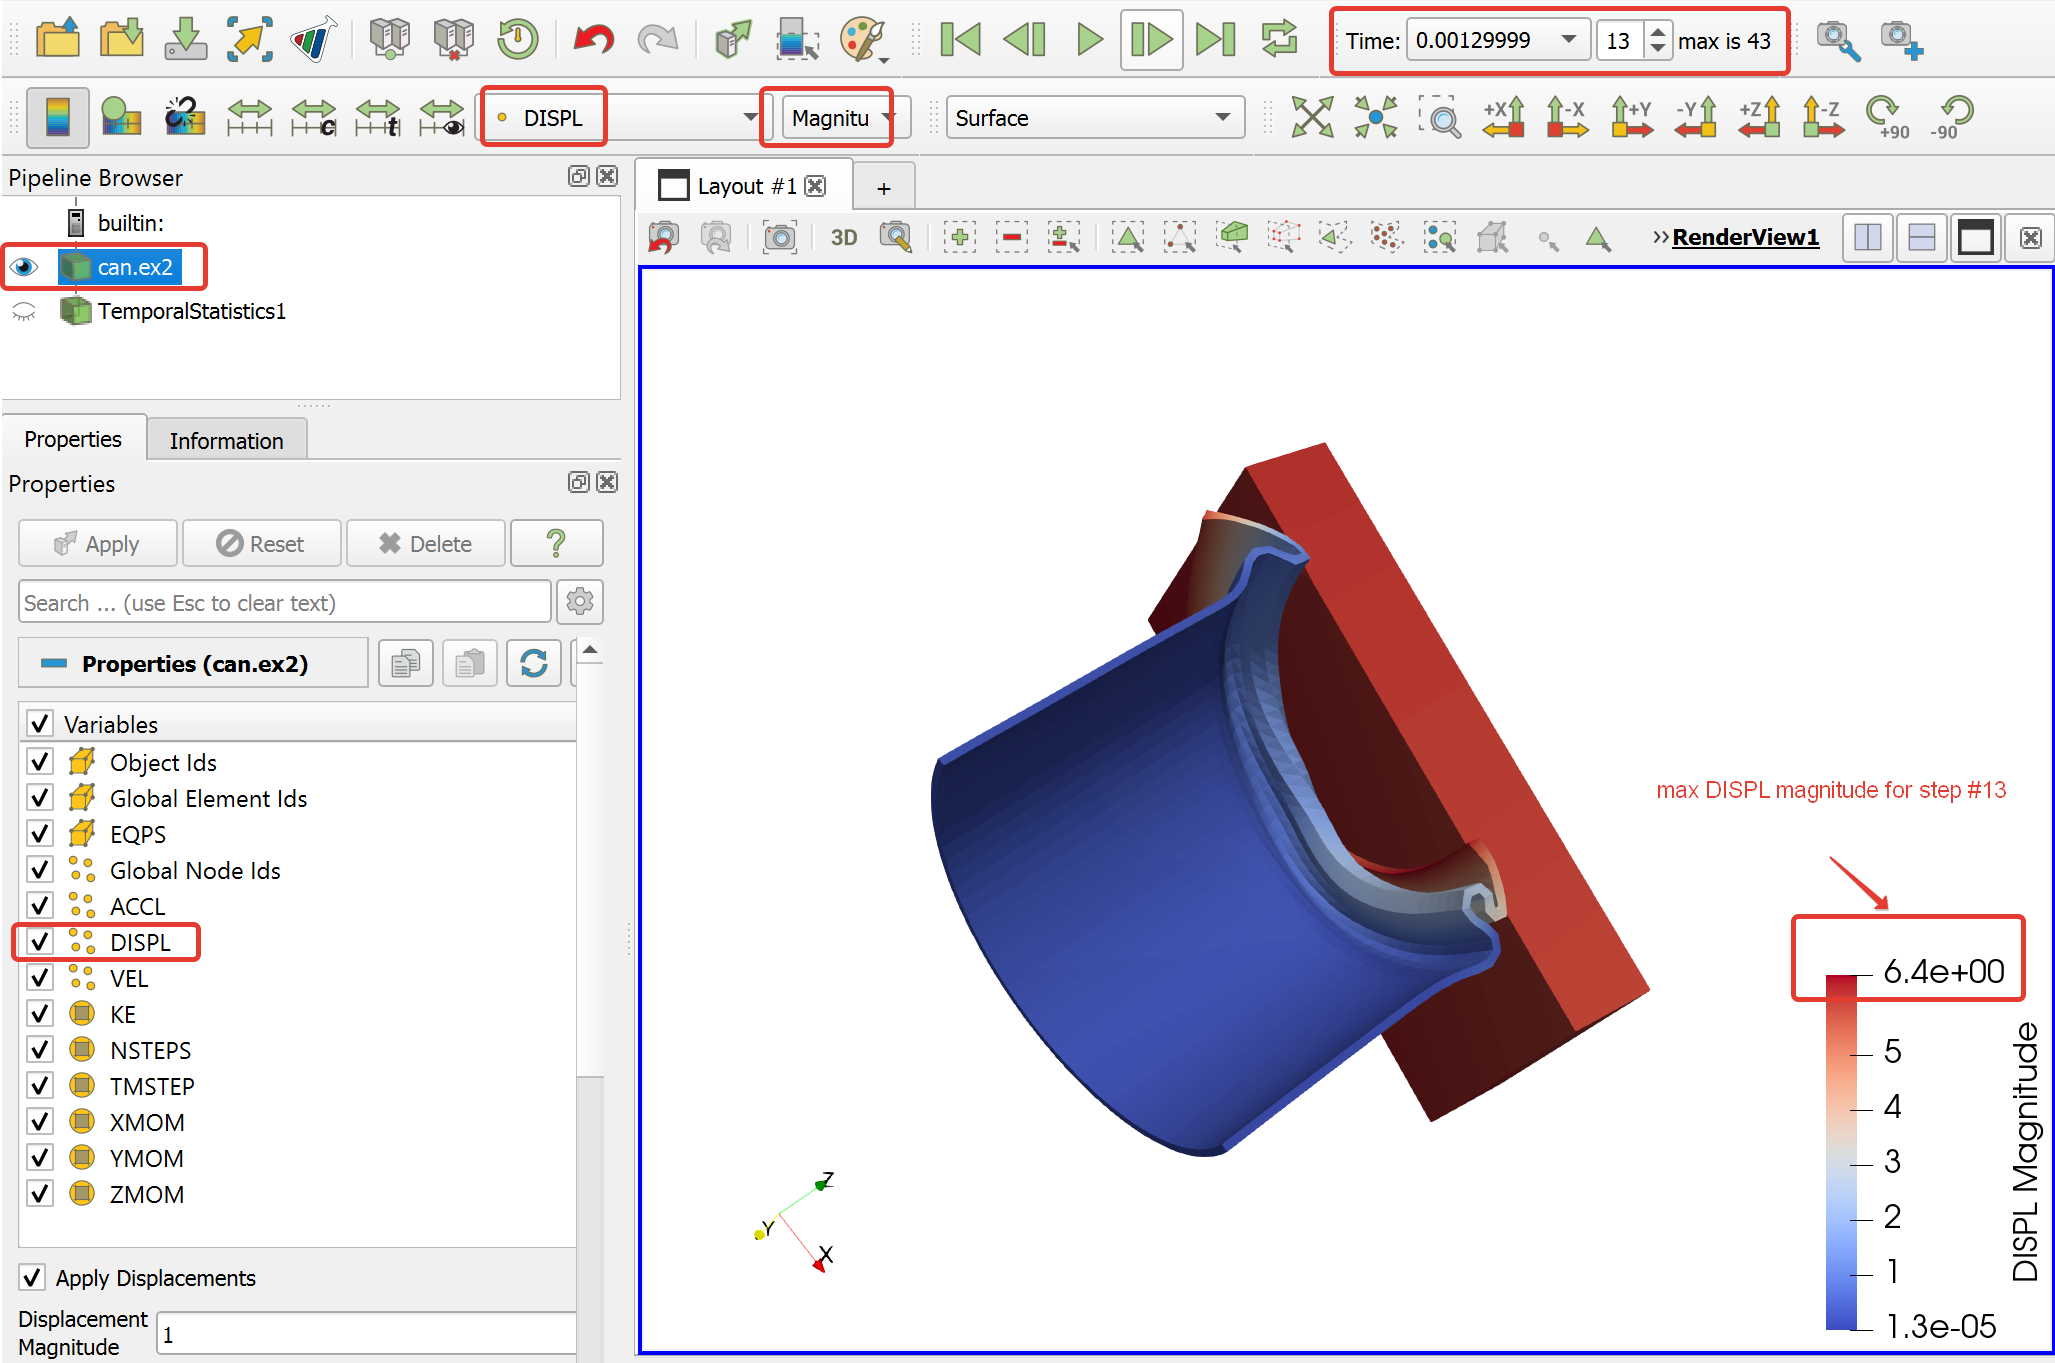
In ParaView, I can access the WSS values for every timestep
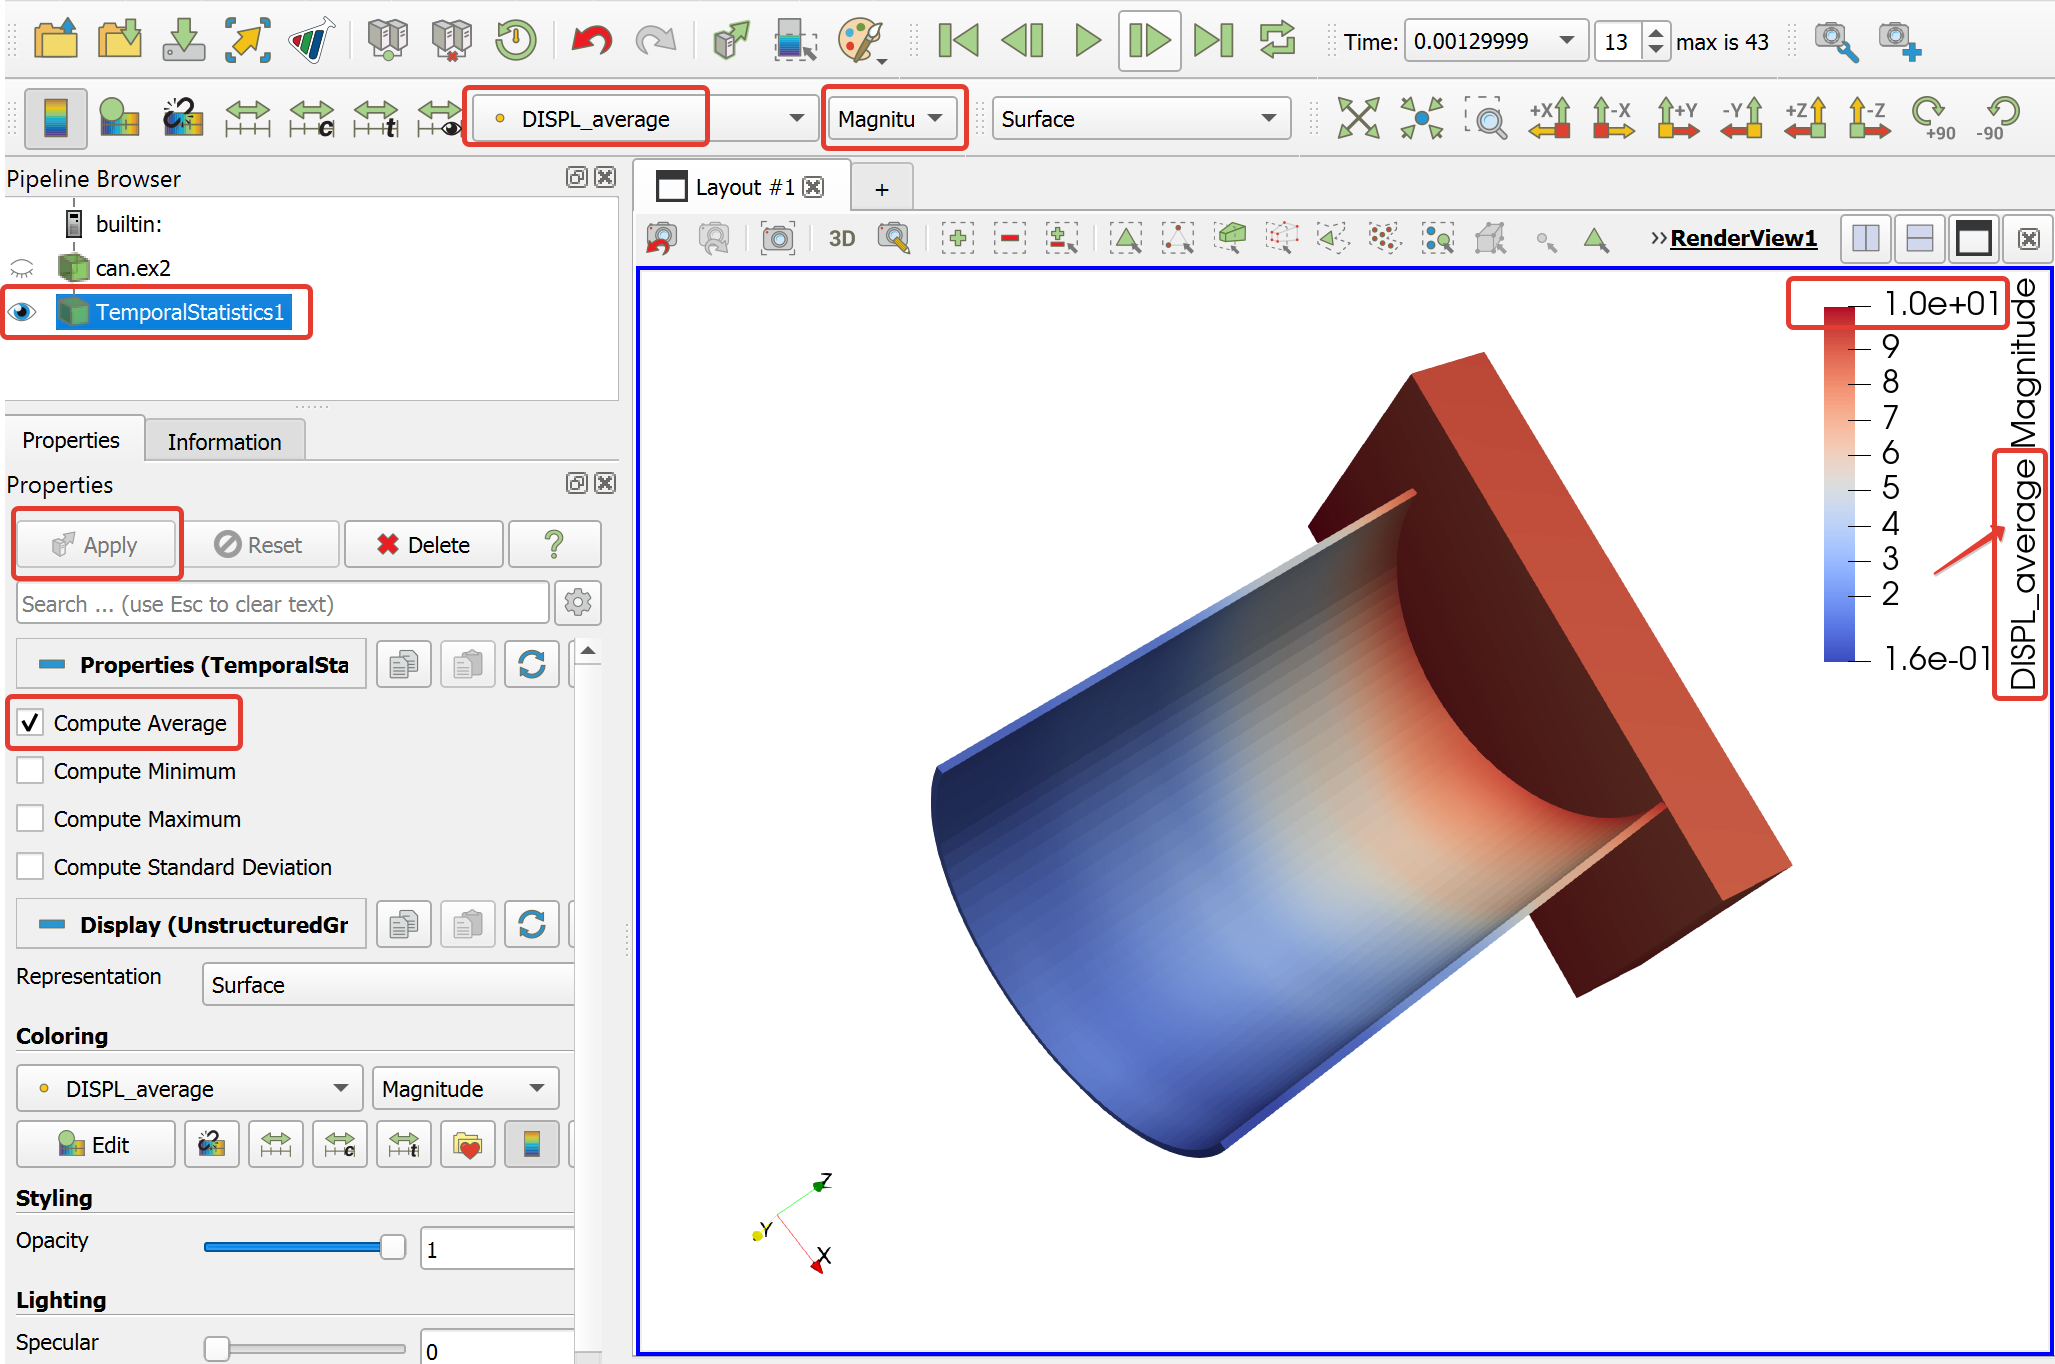
I would like to average these WSS values over three cardiac cycles.
Would it be possible to use a Programmable Filter to compute the oscillating shear index (OSI) and time-averaged Wall Shear Stress (Tawss)? Perhaps, could you refer me to an example of how to use this filter for a purpose such as this?
Thank you in advance for your time.
With kind regards,