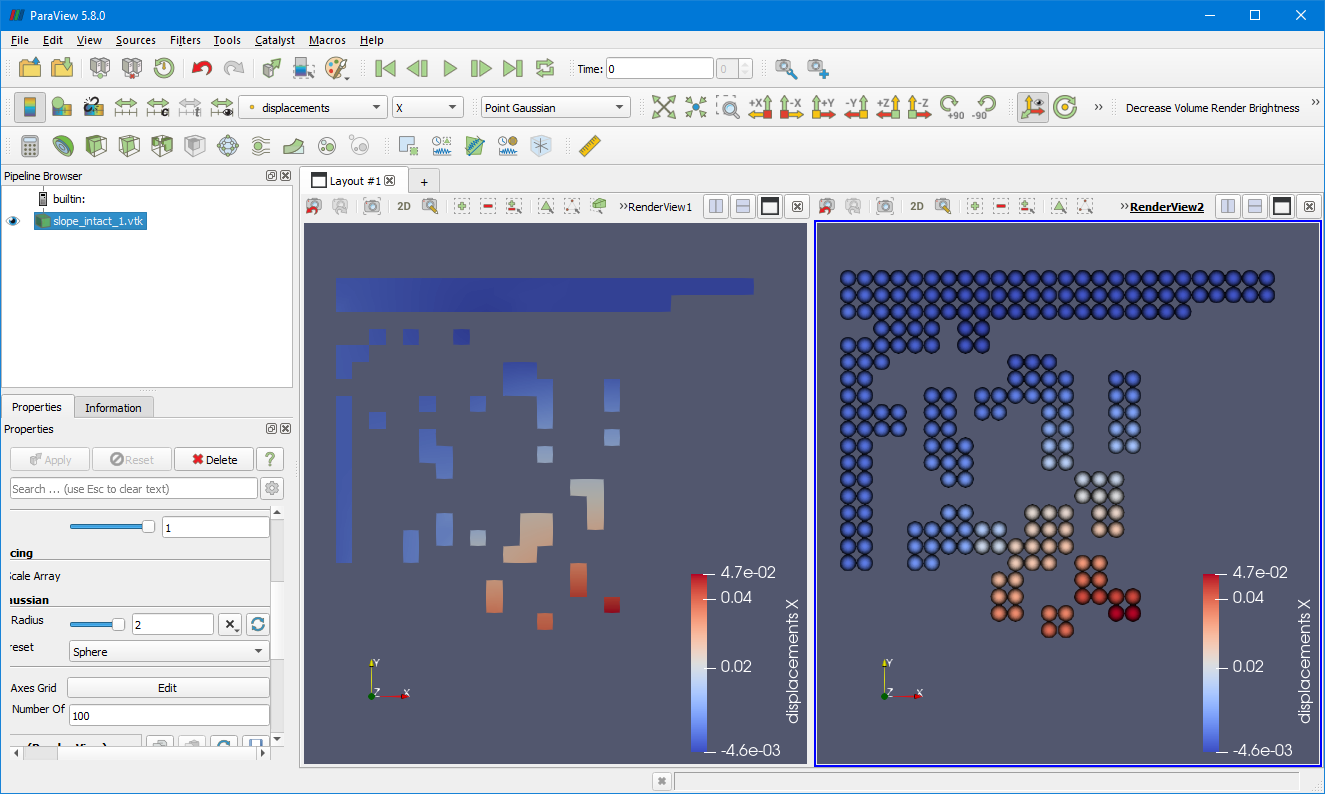
When I import the attached vtk files into my Paraview, and I view the DISPLACEMENT in the X direction on SURFACE, then the color scheme of the object is different from that of the color bar.
But if I view POINT GAUSSIAN instead of SURFACE, then these two color schemes are consistent.
How can I get a consistent color scheme for SURFACE option? Thank you!
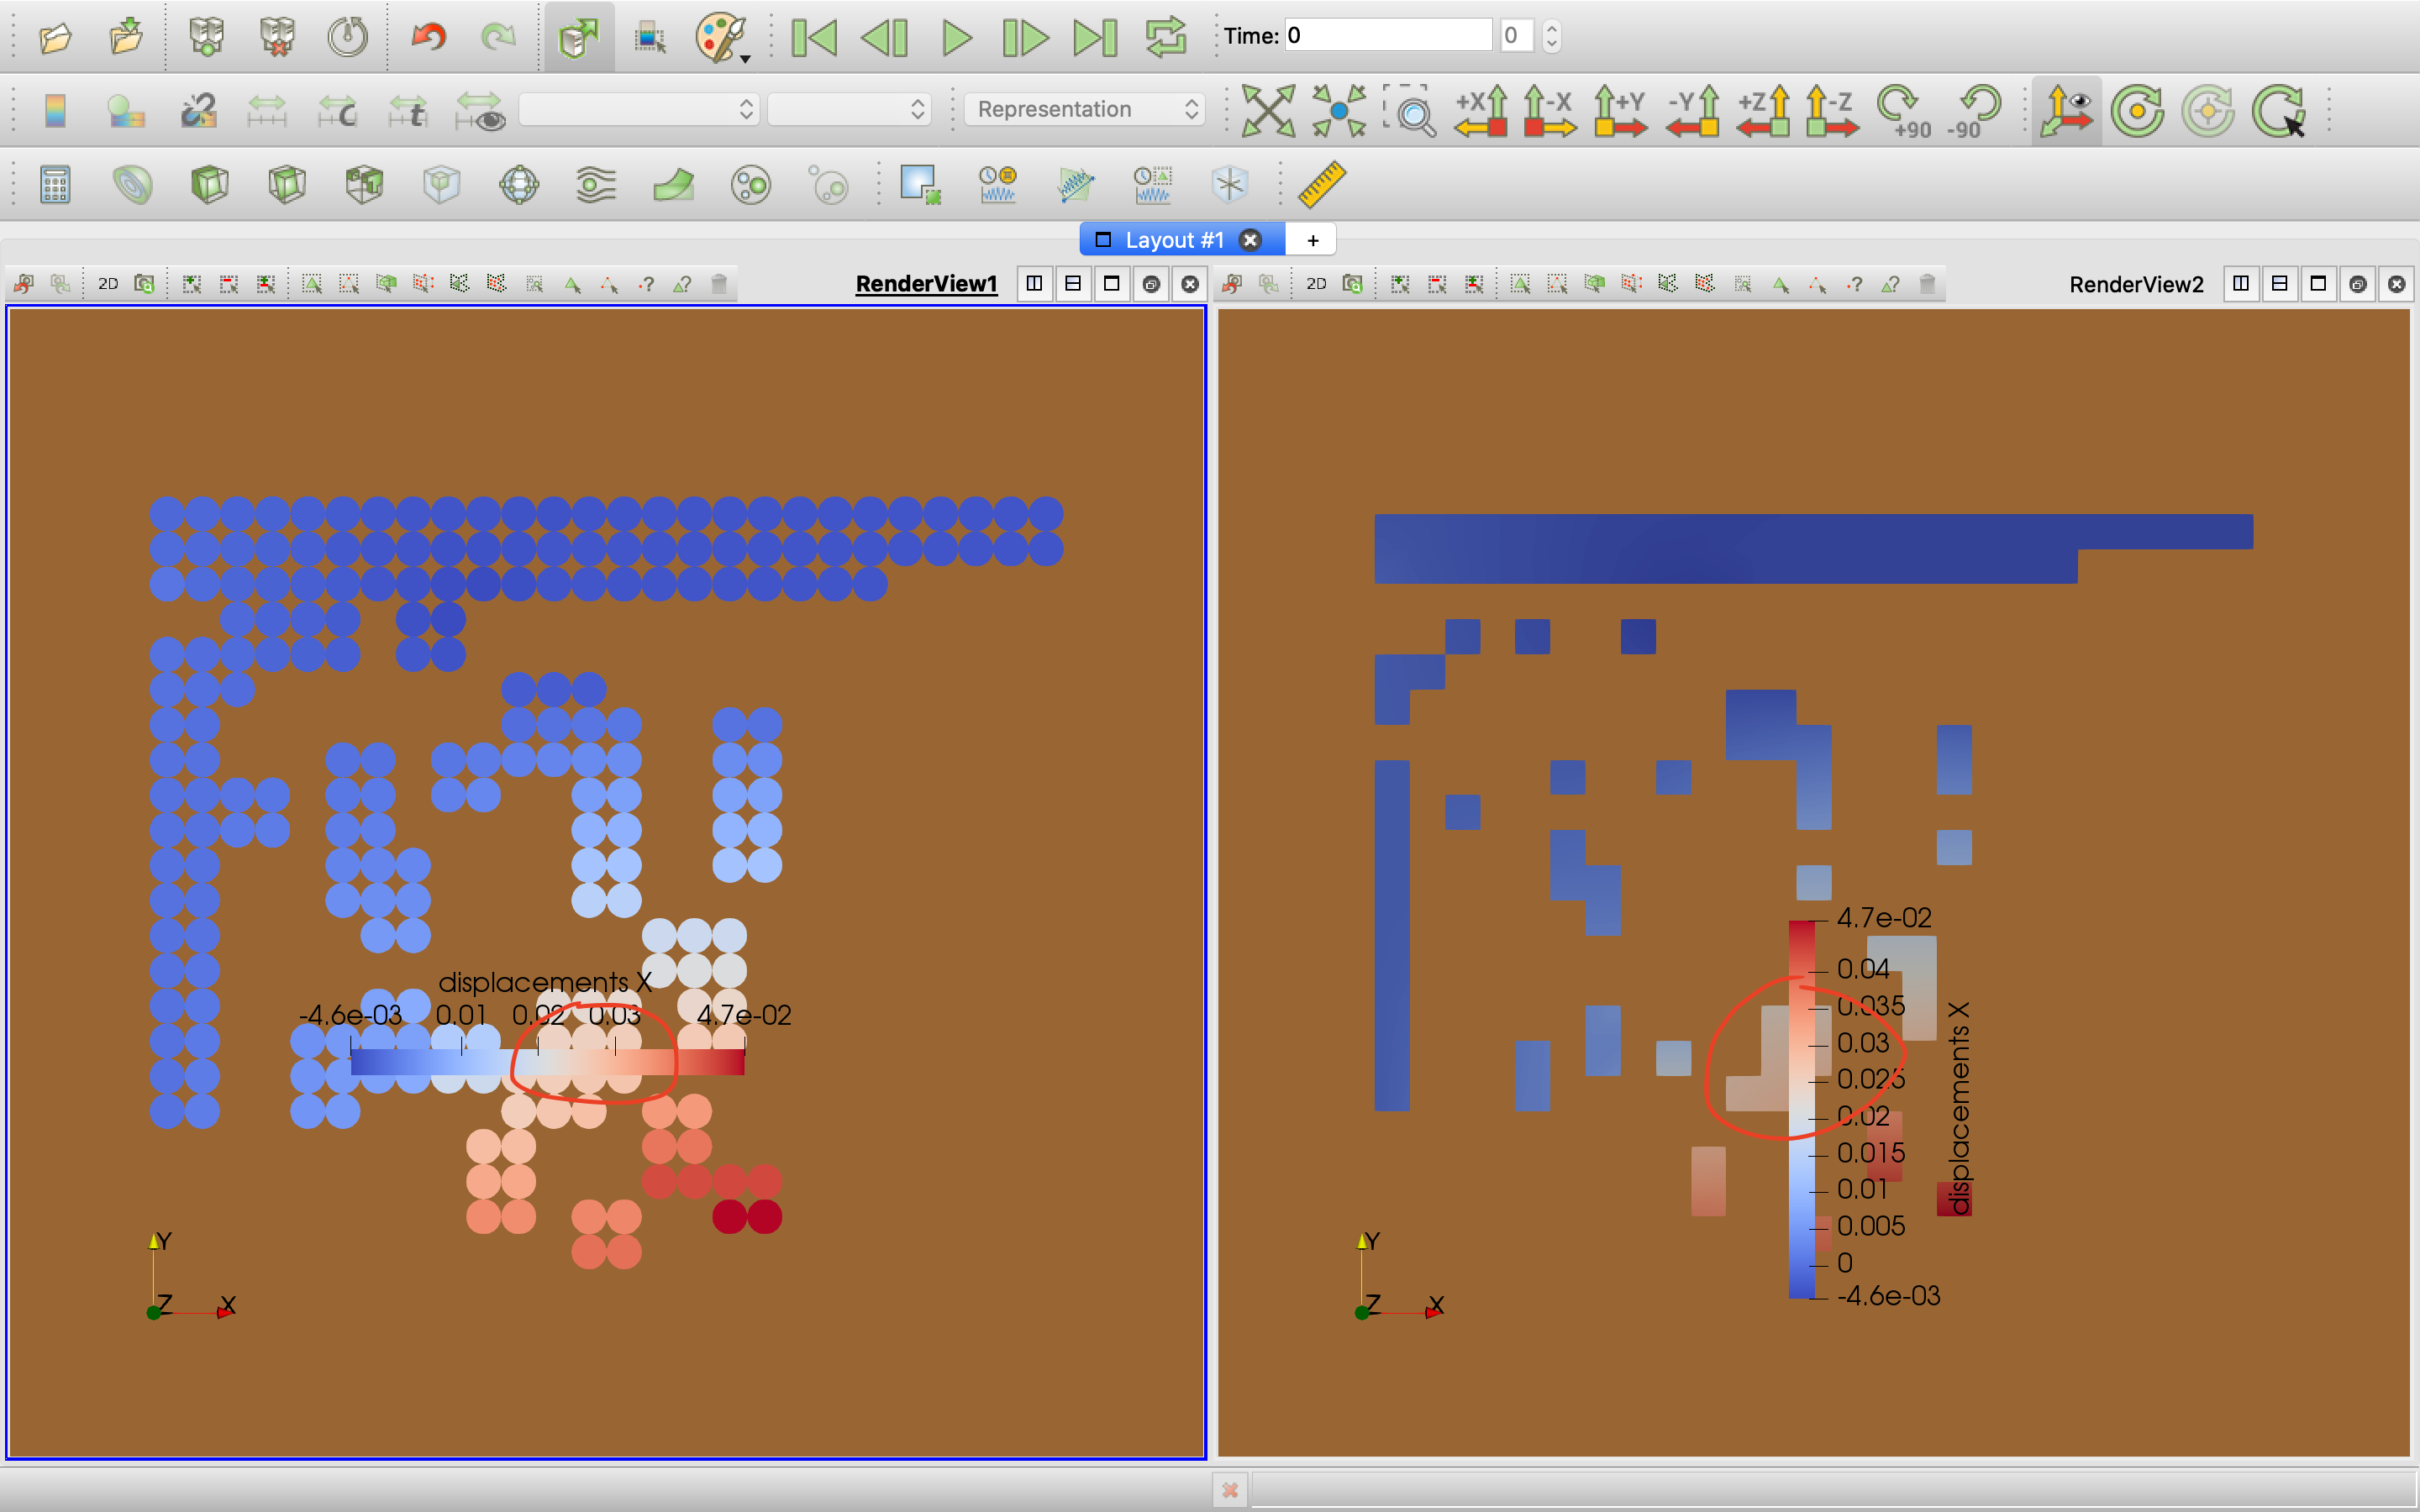
I don’t understand. When I load your data and show the X component of the displacements field, the colors look the same and correct in both Surface and Point Gaussian representations. Here is a screen shot showing that.
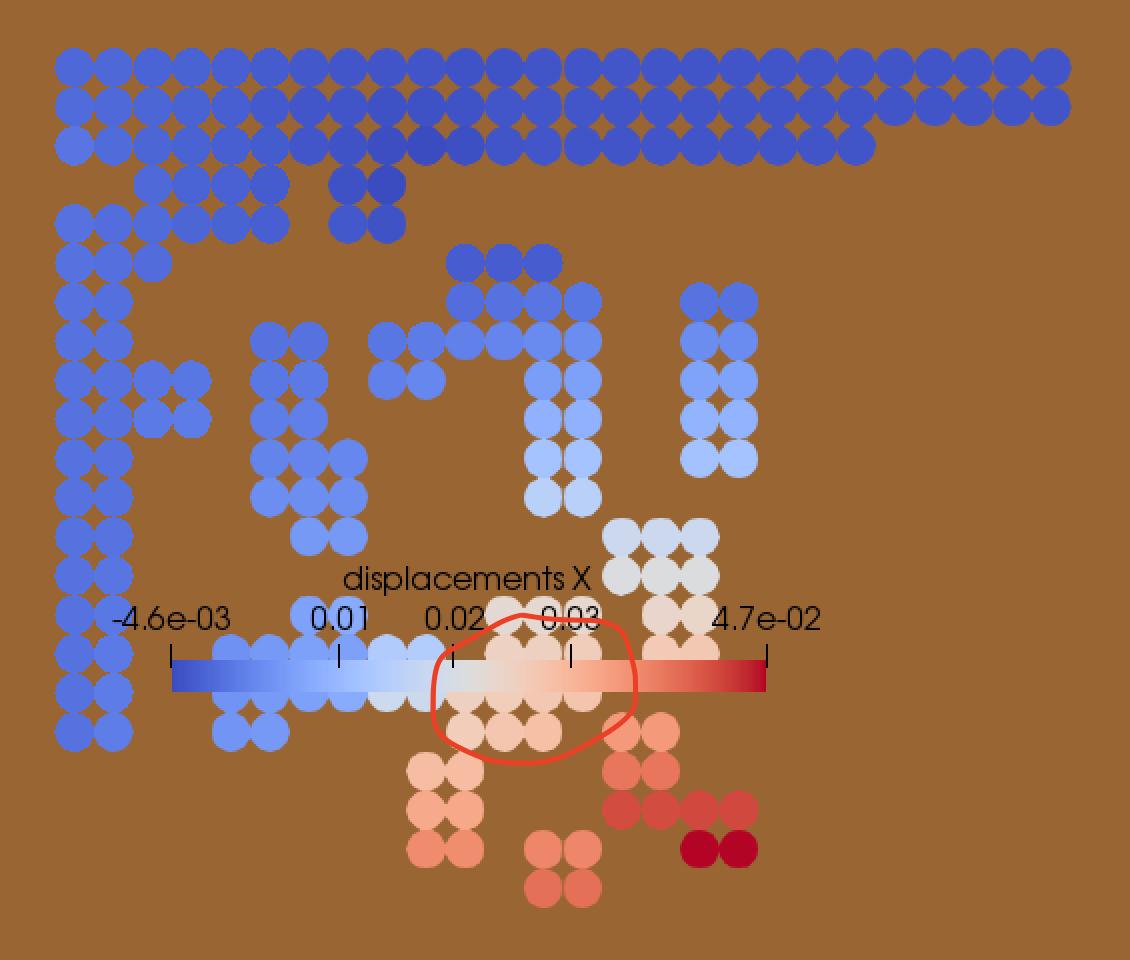
Here is the screen shot in Point Gaussian representation. You may notice the position marked by a red circle, that there is no boundary between the Plain Circle and the Color Bar.
This means the color scheme of the Point Gaussian is consistent with that of the Color Bar. This is correct.
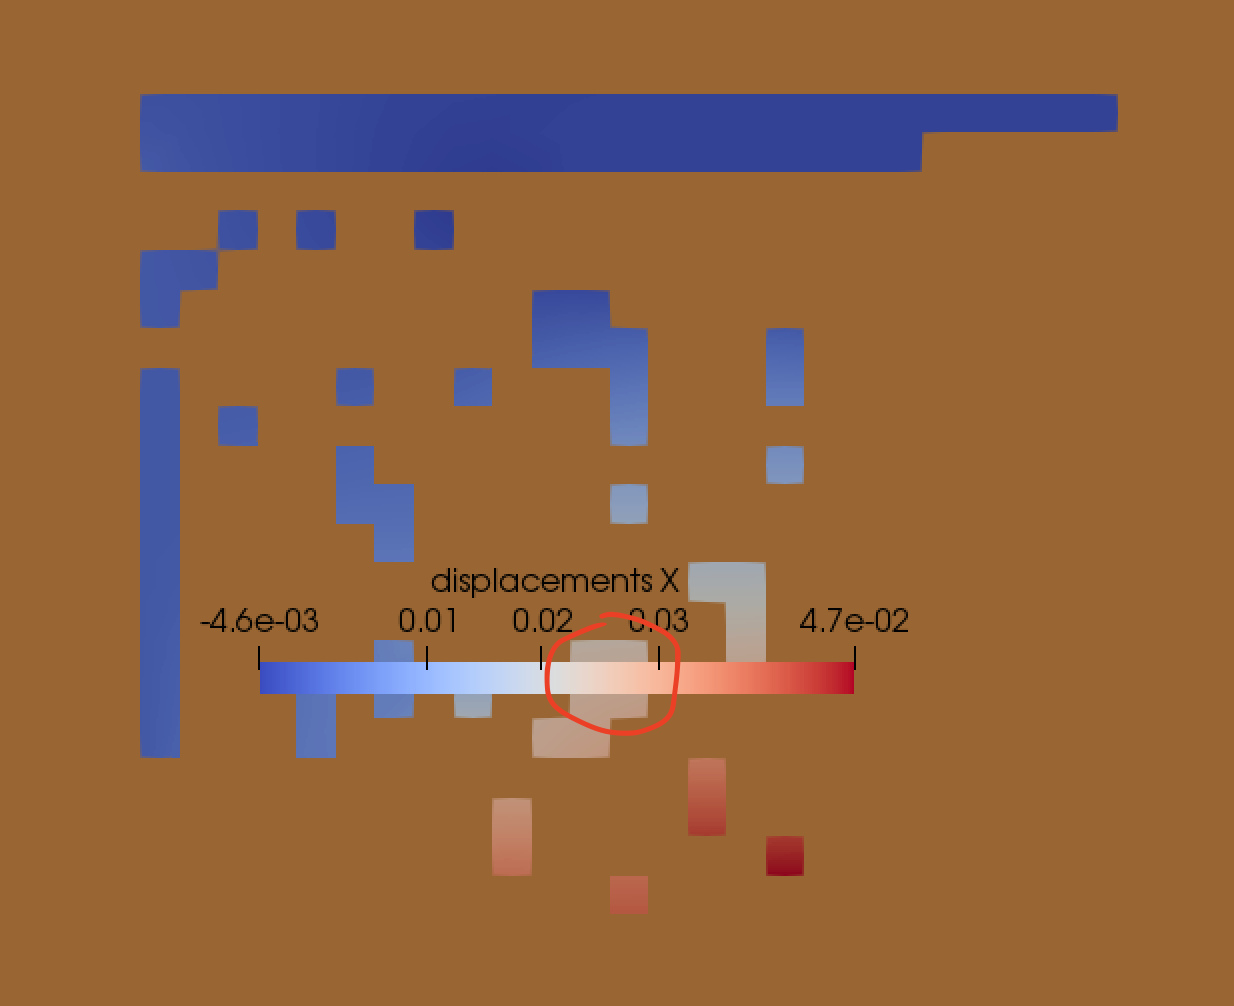
But, it is different in Surface represention.
Here is the screen shot in Surface representation. You may notice the position marked by a red circle, that there is a clear boundary between the Surface and the Color Bar. The clear bounday insists whereever you place the Color Bar, which means the color scheme of the surface representation is different from that of Color Bar. I think this should not happen.
I believe you are seeing the effect of lighting. The surface representation exist in 3D - and it’s surface color is changed based on the angle the surface has to the set of lights used by ParaView.
I’m not sure how to set the lights to remove the effect you are seeing, however.