Hello researchers, I have a group of VTK files about particle information here. I would like to obtain the temperature changes inside the particles, that is, the temperature changes at the particle cross-section. How should I do it? If this problem can be solved, I would be extremely grateful. I hope scholars can provide a detailed operation process, and thank you again.
Particles_vtk.zip (536.2 KB)
Can someone help me? Thank you very much!
Yes. I want to view the distribution of temperature inside each particle, so I need to slice the particles, but I only have these VTK files. How can I achieve the slicing operation? Or can it be achieved by writing Python programs? Could you please provide some guidance? Thank you very much.
You cannot slice points. you need some volumic cells.
Thank you very much for your patient reply. However, the data in these VTKs is not points but multiple particles. These particles are three-dimensional structures; cannot we perform slice operations on them?
Is that a DEM result ? I’m afraid the geometry of the particle is not part of the data you shared.
Yes, this is the result of DEM. I still have some. DAT files. Do you need me to provide these.dat files?
I’m afraid ParaView is not able to reconstruct the particle geometry using .dat files. Can you export the particle geometry to .vtk format ?
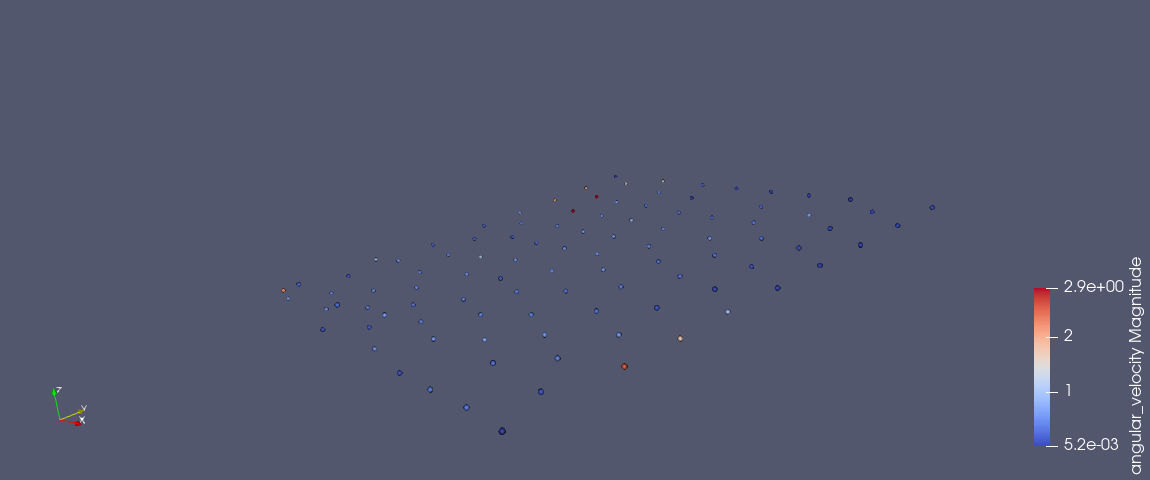
I have exported the VTK file, which also contains information on the physical properties of the particles. There is currently no way to perform slice operations on particles and analyze temperature changes, which I believe is a challenging issue.
Is that enough information to reconstruct the particle geometry?
Previously, someone reported using Paraview to perform slice operations on particles. As far as I know, it is done by writing Python programs, but I don’t know how to operate it, so I am seeking help on this forum.
Please share a link
I have kept you waiting for a long time. The results of the multi-particle slice operation are shown below. Do you have any methods? I would greatly appreciate it if you could help me.
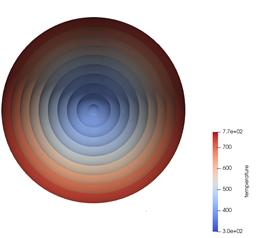
How was this image generated ?
I asked them, and they said this is the result generated through Python code. However, they did not provide any further details. I am so weak.
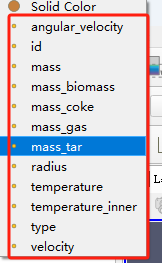
You could create sphere for each particles based on the radius value, is that what you want ?
Based on what you said, I can take a look at the results. But I don’t know how to operate it. I’m sorry.
radius is always 0.00032500000088475645 in your data, so I dont know what you want to do.
I note that there is a field named temperature_inner that I take to be the temperature at the center of the particle and a second temperature, which I guess is the temperature at the surface of the particle. I guess you can assume some regular interpolation (linear? quadratic? exponential?) between them on the inside of each particle.
ParaView can easily show your particles as spheres with the radius scaled by that field. But these spheres will actually be shells (as in most cases they are considered homogeneous items). There is no automatic mechanism to create a filled sphere, nor is there an easy way to interpolate the field within this space.
Based on the image you posted, it looks like a series of shells were created around the particle (perhaps by using the Glyph filter and varying the Scale Factor) and then the temperature was interpolated (perhaps by using a Calculator expression). From there the shells could be clipped away.
I don’t have the spare hour to come up with such a script. If you could get your hands on that script, we might be able to help you apply it.