Researchers, I have some VTK files about particle information and different gas products. I want to obtain a graph of the product’s variation over time, but I don’t know how to operate it. Can you help me get the result? It will be appreciated if the problem can be solved. Thanks
VTK.zip (3.7 MB)
everyone.
Thank you very much for your reply. I would like to know the specific operation process. Can you provide it?
- run ParaView
- File → Open → particle…vtk → Apply
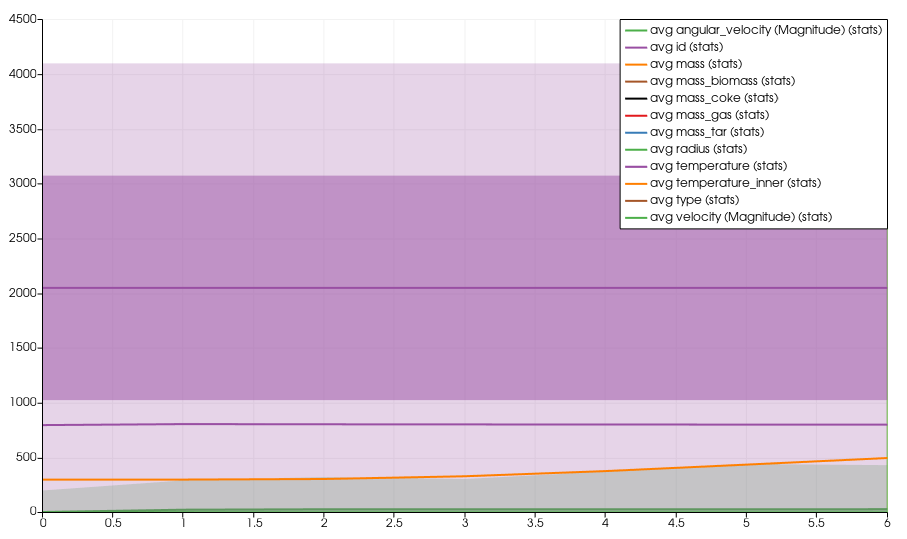
- Filters → Alphabetical → PlotDataOverTime → Apply
Thank you for your patient reply. I just succeeded. But I also want to export a file with data that changes over time. How should I do this?
After following @mwestphal’s instructions, save the data. Either File → Save Data... or click ![]() in the toolbar on the upper left.
in the toolbar on the upper left.
You can save the data as a csv file, which can be loaded in other tools such as a spreadsheet like Excel or Google Sheets.
Thank you for your patient reply.