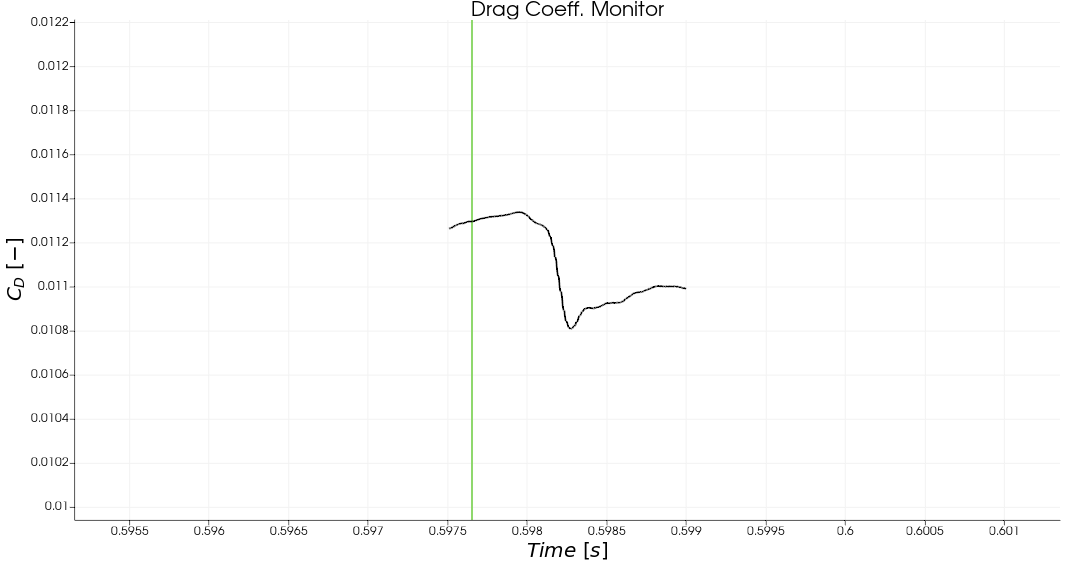
I ran into a quite strange problem in paraview, I am using the plotDataOverTime filter after a temporaryShiftedData filter and the time marker is not displayed during the animation:
I have uploaded a simplified version of my code where you can execute the python script (just make sure to modify the path where you are running it) that will load the monitors (from the Cx_Cz_Cm.plt file), it will generate 300 snapshots stored in the folder forces_csv and will load them as temporary shifted data that I plot in 2 graphs at the bottom of the paraview layout. After you execute the code, you can play the animation but you will only be able to visualize the Time Marker if you zoom out (first post of this thread).
I need to use the plotDataOverTime filter after a temporaryShiftedData because I need to synchronize my force monitors and my flow snapshots that come from different sources.