time-varying auxiliary coordinates are lost when merging files in xArray

Dear PARAVIEW community,

greetings. This is Marco, I am new here, recently started used this wonderful tool. I hope this email finds you all well.

I have a question regarding the creation of time-varying auxiliary curvilinear coordinates, that I’d like to append to a netcdf files. For pre-processing, I am using Python.

As an example, I am starting from the available netcdf inside the xarray package: https://xesmf.readthedocs.io/en/v0.1.2/Curvilinear_grid.html
When printing the array in Python (headers), I get:

Dimensions: (time: 36, x: 275, y: 205) 

Coordinates: * time (time) datetime64[ns] 1980-09-16T12:00:00 1980-10-17 ... 
xc (y, x) float64 189.2 189.4 189.6 189.7 189.9 190.1 190.2 190.4 ... 
yc (y, x) float64 16.53 16.78 17.02 17.27 17.51 17.76 18.0 18.25 ... 

Dimensions without coordinates: x, y 

Data variables: Tair (time, y, x) float64 nan nan nan nan nan nan nan nan nan nan ...

In Python, I managed to mimic the structure of the file linked above. The field I am encapsulating into the newly-created netcdf file (in the example above: Tair) is timevarying but, unlike the example linked above, my xc, yc coordinates are timevarying too.

Instead of y, I am actually working over the vertical coordinate (x,z, time). So, when coding in python I added to zc (or yc in the original example) another dimension: time. Inside my for loop, when assigning Tair values for each timestep, I impose new yc coordinates too:

ds = xr.Dataset(
    {
        q2merge: ([ "time", "z", "x"], sal), #sal = salinity
    },
coords={
     "time": write_t_sereis(newt),  #custom function to convert to time
     "xc": (["time","z","x"], np.empty([nt, nz+1, nx],dtype='float32')),
     "yc": (["time","z","x"], np.empty([nt, nz+1, nx],dtype='float32')),  #------- as in CHapter 6.2. of http://cfconventions.org/cf-conventions/cf-conventions.html#discrete-axis 
},

)#

#Start a time-marching loop and, at each time-step, append:
# - new vertical coordinates z
# - scalar field at timestep t 

c= 0 # some counter
for thatStep in T:  
    yc[c,:,:] = Function_to_extract_zcoords(thatStep)    # yc = yc(time, z, x)
    
    # .....
    # Add scalar field
    ds[q2merge][c,:,:]=Function_to_extract_ScalarField(thatStep)
    # .....


    c = c +1

#Outside the loop, once done, append metadata:
ds['xc'].attrs['axis']="X"
ds['xc'].attrs['long_name']="longitude of grid cell center"
ds['xc'].attrs['units']="degrees_east"

#Should be vertical, Z, but it seems that PARAVIEW has a bug (see below)
ds['yc'].attrs['long_name']="latitude of grid cell center"
ds['yc'].attrs['units']="degrees_north"

ds.attrs['coordinates']="yc xc"

ds.close()                          #close the door when you leave
fname= "{}.nc".format(q2merge)      #some meaningful name
ds.to_netcdf(fname, unlimited_dims={'time':True})    #flag as unlimited      

However when I try post process that result (all t-steps in one file) in PV and visualize the results, vertical coordinates are not varying (here I call them “y”, but they are actually vertical, as PV seems to have a bug and fails in recognizing it. For the record, an issue was already posted: https://gitlab.kitware.com/vtk/vtk/-/issues/18035 ).

I tried saving all timesteps separately. In this case, I see that each time-step vertical structures preserves the desired structures (height of vertical levels), meaning that I can see the actual wire-frames fluctuating. However, when merging manually (with cdo or with nco), everything gets lost.

My questions:

  • does xarray allows time-varying auxiliary coordinates?

  • if so am I doing it correctly?

  • is the problem in my python code? or is PV not (yet?) able to understand time-varying coordinates?

If needed, I’d be happy to share my Python code as well as individual/merged netcdf files.

Thank you so much for the time you will dedicating to this.
Update:

So far, after having played a bit around with programmable filters, I came up with the following:

	input = self.GetInputDataObject(0, 0)
	output = self.GetOutputDataObject(0)
	
	output.ShallowCopy(input)
	newPoints = vtk.vtkPoints()
	numPoints = input.GetNumberOfPoints()
	
	t =self.GetInputDataObject(0,0).GetInformation().Get(vtk.vtkDataObject.DATA_TIME_STEP())
	print("time: ",t)
	
	
	#foreach gridpoint in my domain:
	for i in range(0, numPoints):
            #extract coordinates
	        coord = input.GetPoint(i)
	        x, y, z = coord[:3]


	        #some crazy testing
	        if x >.1 and x<1.5:
	            y= y + .1*x*t
             
            #insert 
	        newPoints.InsertPoint(i, x, y, z)


	#impose new points (modified!)
	output.SetPoints(newPoints)

This would basically read in my time-varying 1D section. The initial topology looks good. However, as usual, when navigating trough time-steps, topology does not change (as it should in fact do).

The script above manages to artificially tweak the grid coordinates in a given sub region. I can actually see the grid lifting off. Now, instead of prescribing some crazy ad unphysical values, my aim is to plug in the time-varying coordinates I have stored somewhere:
where are they and how can I possibly access them??

I have noticed that this script would work with DataSets but not with DataArrays (both produced in xarray, python).

Getting closer…

I think I could solve it. It is not the most elegant solution, but it does what it should and I am satisfied with the result.

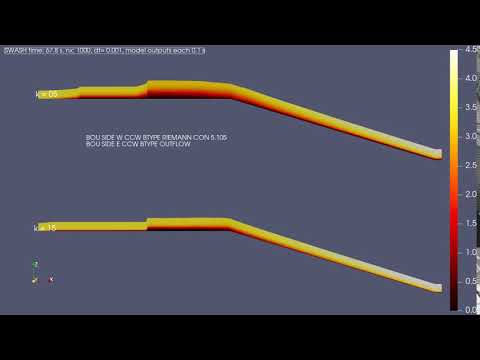
I could solve it by storing the (vertical, time-varying) coordinates into a conventional variable (that I named “zk”). Combining that with the filter I described above, I could have my mesh lines fluctuating up and down, so to reproduce the exact model output.

The animated result is available here:

However, I am still looking for a robust and elegant way to include the (time-varying) coordinates. That would also allow me to skip the second step, i.e.: using the programmable filter to extract and impose.
Is there any chances I could make a request for that to the developers? With the material I have (developed) so far, should be a bit easier to implement all that?

Cheers

:wave:

Not sure to follow what your programmable filter do, could you clarify ?

Reading the whole thread, it looks like this all a workaround a vtkNetCDFReader bug. Maybe fixing this issue should be more important ?

Hi there, Mathieu!

Thanks for your feedback.

About the filter:

  • It is the second of the two steps necessary to pre-process, import, transform and view my original model-generated data.

  • The first step, involves some python code that converts matlab (*.mat) files into a netCDF file. But that would not suffice, thus the need for an extra layer of processing.

  • The PV filter has mainly 2 functions:
    (a) read in time-varying coordinates, not allowed in ancillary coordinates, and prescribe that to the time-invariant vertical coordinates. So, for each timestep, the z topology is ingested and prescribed to that same timestep.
    (b) PV seems to fail in recognizing that my intended vertical axis, is the actual vertical axis (z). Instead that is interpreted as y-axis (despite appending all the needed metadata, like: axis name, axis units, etc…). So the filter swaps y and z, after having replaced the coordinates. A ticket wasa already opened, see link above.


Yes, I agree that fixing this bug would be the best solution, as it would make the filter unnecessary. So, once ancillary coordinates can be read in as time-varying, there would be no more need to store them separately and impose them, making everything more agile and smooth.

Have a nice sunny day.

1 Like