Hello all,
I have a 1-D exodus file with the following coordinates:
 coordx = 5.22, 4.698, 4.176, 3.654, 3.132, 2.61, 2.088, 1.566, 1.044,
    0.521999999999998, 0 ;

 coordy = 0, 6.39265629154918e-17, 1.27853125830984e-16,
    1.91779688746476e-16, 2.55706251661967e-16, 3.19632814577459e-16,
    3.83559377492951e-16, 4.47485940408443e-16, 5.11412503323935e-16,
    5.75339066239427e-16, 6.39265629154918e-16 ;

 coordz = 0, 3.19632814577459e-17, 6.39265629154918e-17,
    9.58898443732378e-17, 1.27853125830984e-16, 1.5981640728873e-16,
    1.91779688746476e-16, 2.23742970204221e-16, 2.55706251661967e-16,
    2.87669533119713e-16, 3.19632814577459e-16 ;
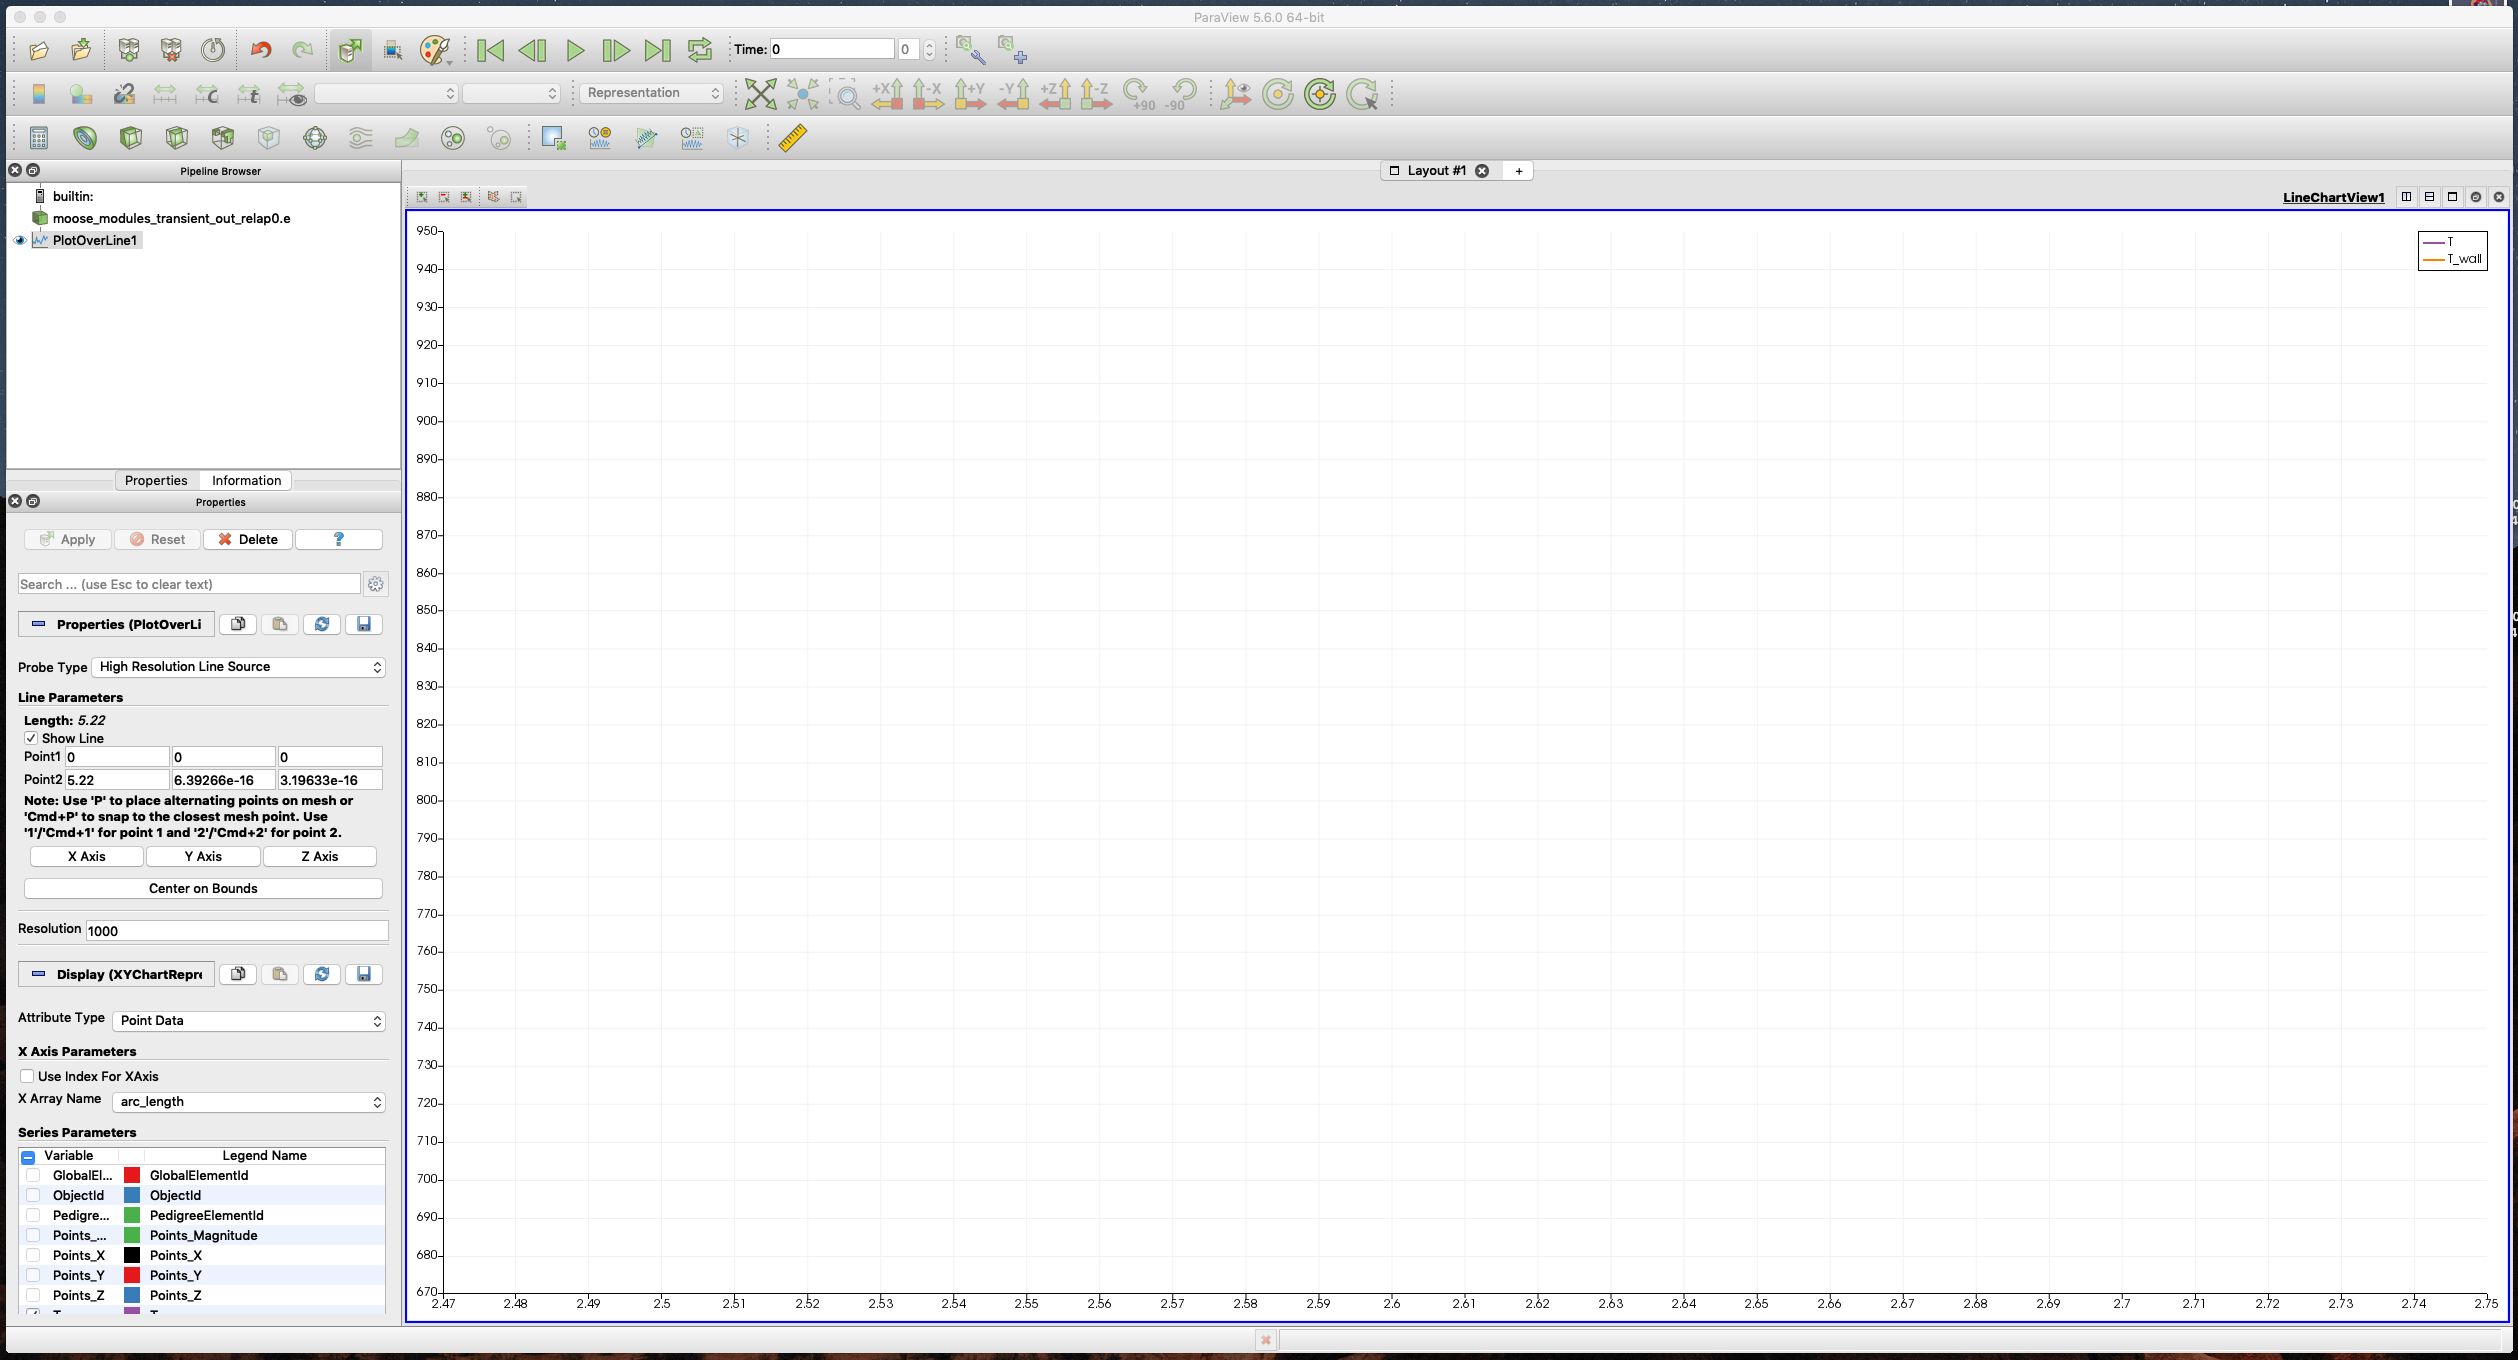
If I try to plot one of my variables using ‘Plot over line’, I get:
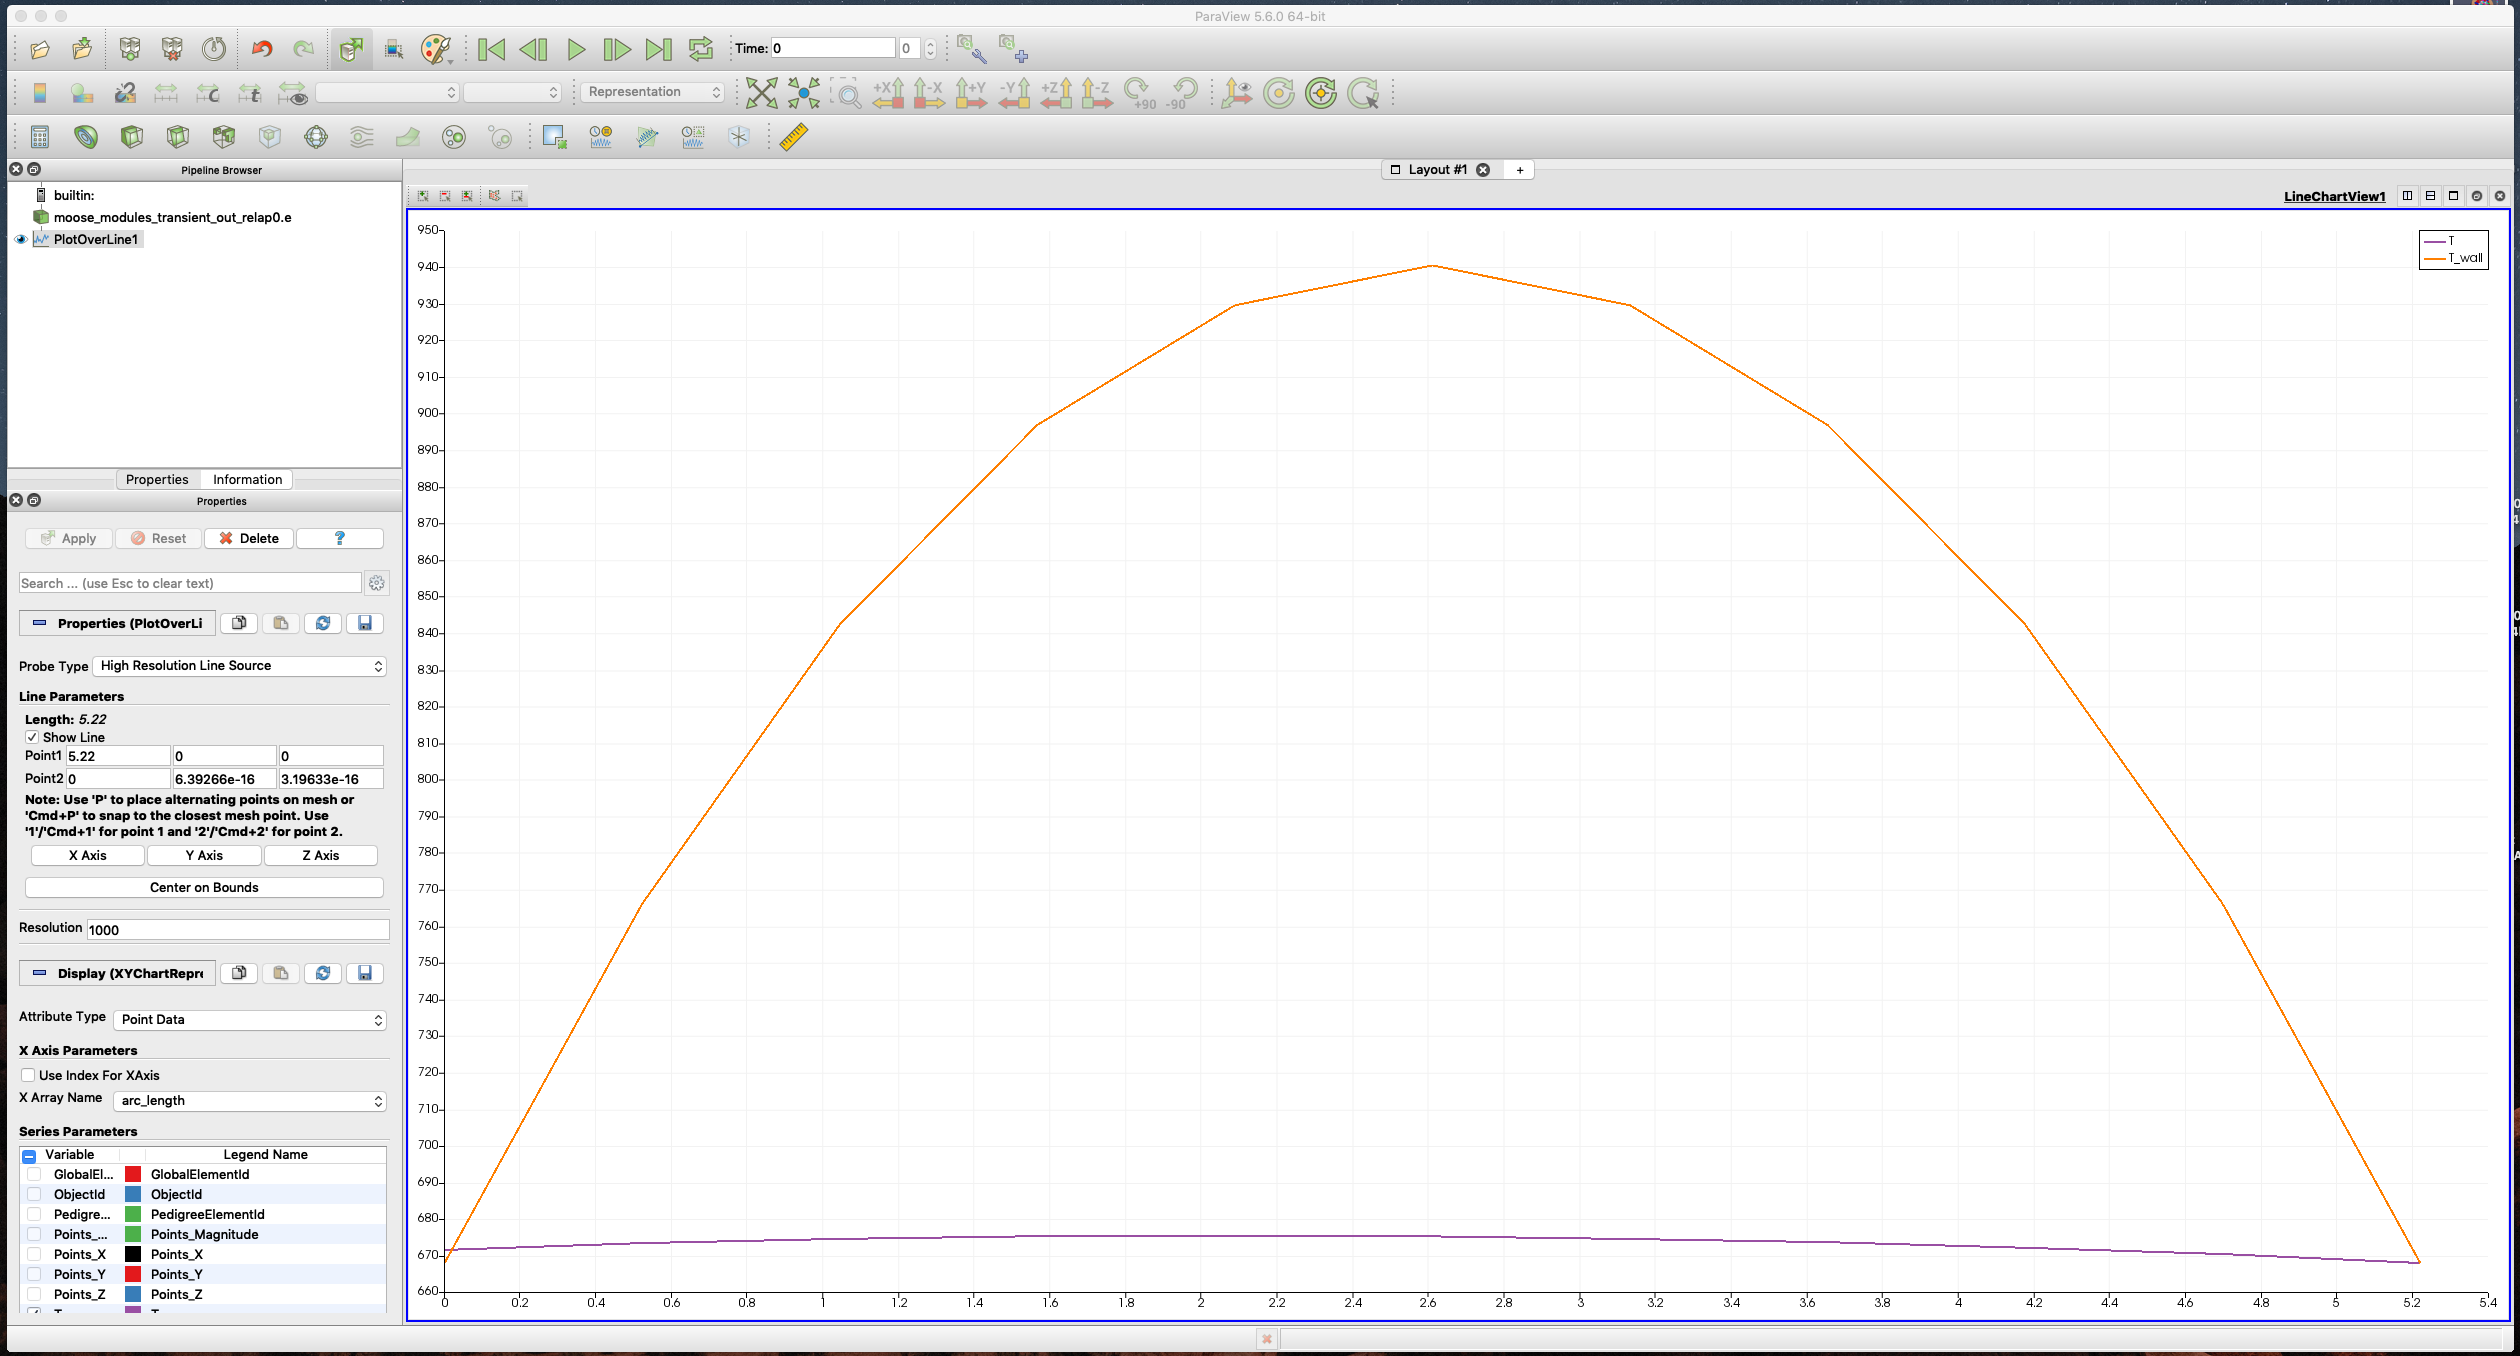
If instead I force the plot to go from xmax to xmin, then I get what I expect:
It looks like Paraview does not handle properly the ‘numerical zeros’ in the former case. Unfortunately, the mesh generation cannot return exact zeros because it allows to rotate the mesh, hence the very small values.
I did try to uncheck the Compute tolerance box and to put a larger number (e.g. 1e-5) but the former plot still remains the same. Many people at the lab here have been experiencing that same issue but no one seems to know how to properly address it.
So my question is: is there a way to fix it or is it a defect?
Thanks in advance!
Vincent