I am new user in paraview. I would like to process triangular unstructured mesh data in paraview. I am struggling loading correctly the data in paraview. The netcdf data loads perfectly fine. Paraview understand the global coordinates, but it fails to render the triangles. I am probably missing a attribute in the netcdf file. I tried “element_type” without success. Any ideas as how could I do it? Thanks in advance for all your help.
thanks so much for your reply. I attach you a link with two files. The first one is the raw netcdf data (fesom_netcdf.nc). If you load it you can see the globe and the topography with hexagons instead of triangles. I did a bit of research about the format. It seems that I needed to convert it to netcdf ugrid (fesom_netcdf-ugrid.nc). However, I failed as I get a flat disk. I think I am getting there but I am not sure what else I am missing. This is the code I used to convert it to ugrid.
The data should describe the topography of the ocean (globally), but it seems that the k axis is zero. In fact, you can see that if you open the spreadsheet. The curious thing is there is an extra variable that I did not make points magnitude there..If you read the netcdf with another software (matlab, python etc), you can see that the k axis varies as it suppose to do. Thus, paraview is not reading well the axis or I did not format properly the file. It could be my fault as it is the first time that I do it.
as for the original fesom data, you should be able to open it straight away with CDIReader (which is available in the current nightly builds and should soon be part of the superbuild as well). CDRreader supports both FESOM and ICON grids.
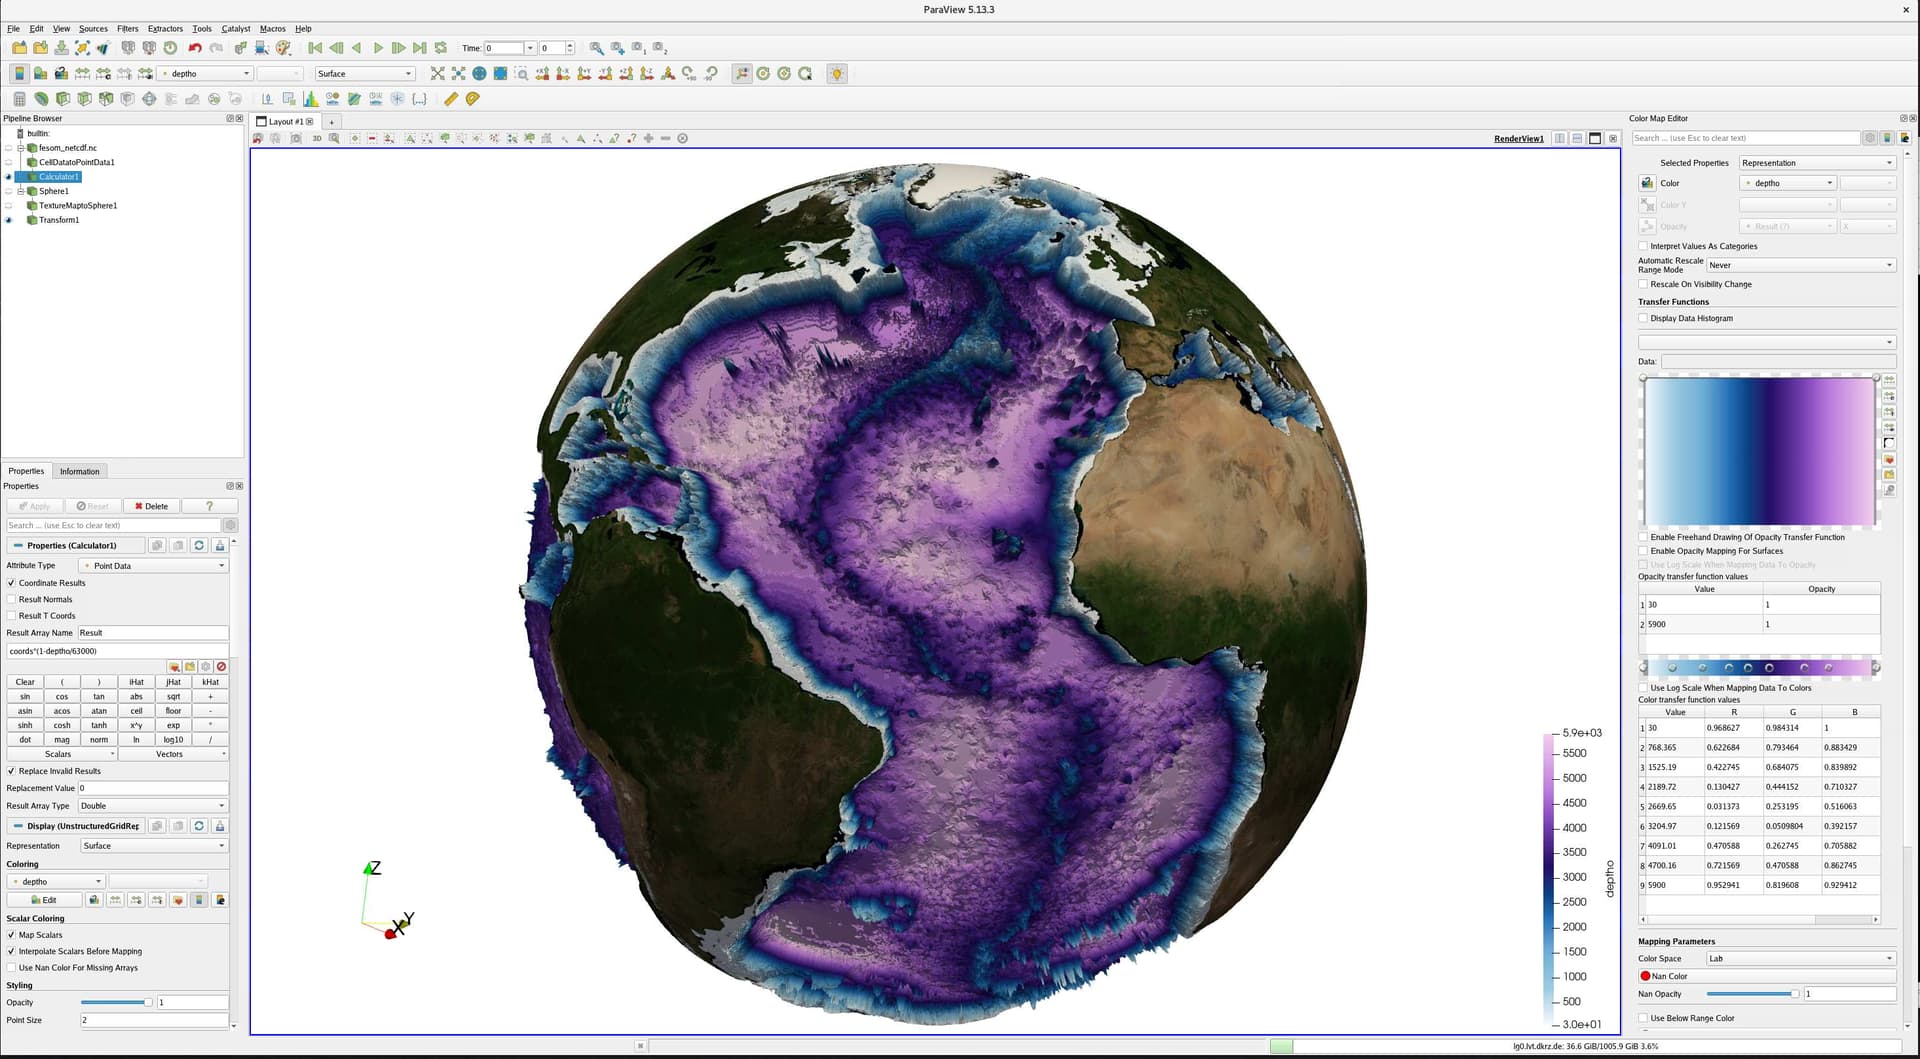
If the bathymetry is a variable on the fesom grid, you can perform the vertical extrusion according to its values with the calculator:
the windows 5.13.3 version does not have that plugin. I downloaded this one cdiReader for Paraview download | SourceForge.net. However, paraview blows everytime that I try to open a netcdf. I think this plugin is not compatible anymore with the latest version of paraview.
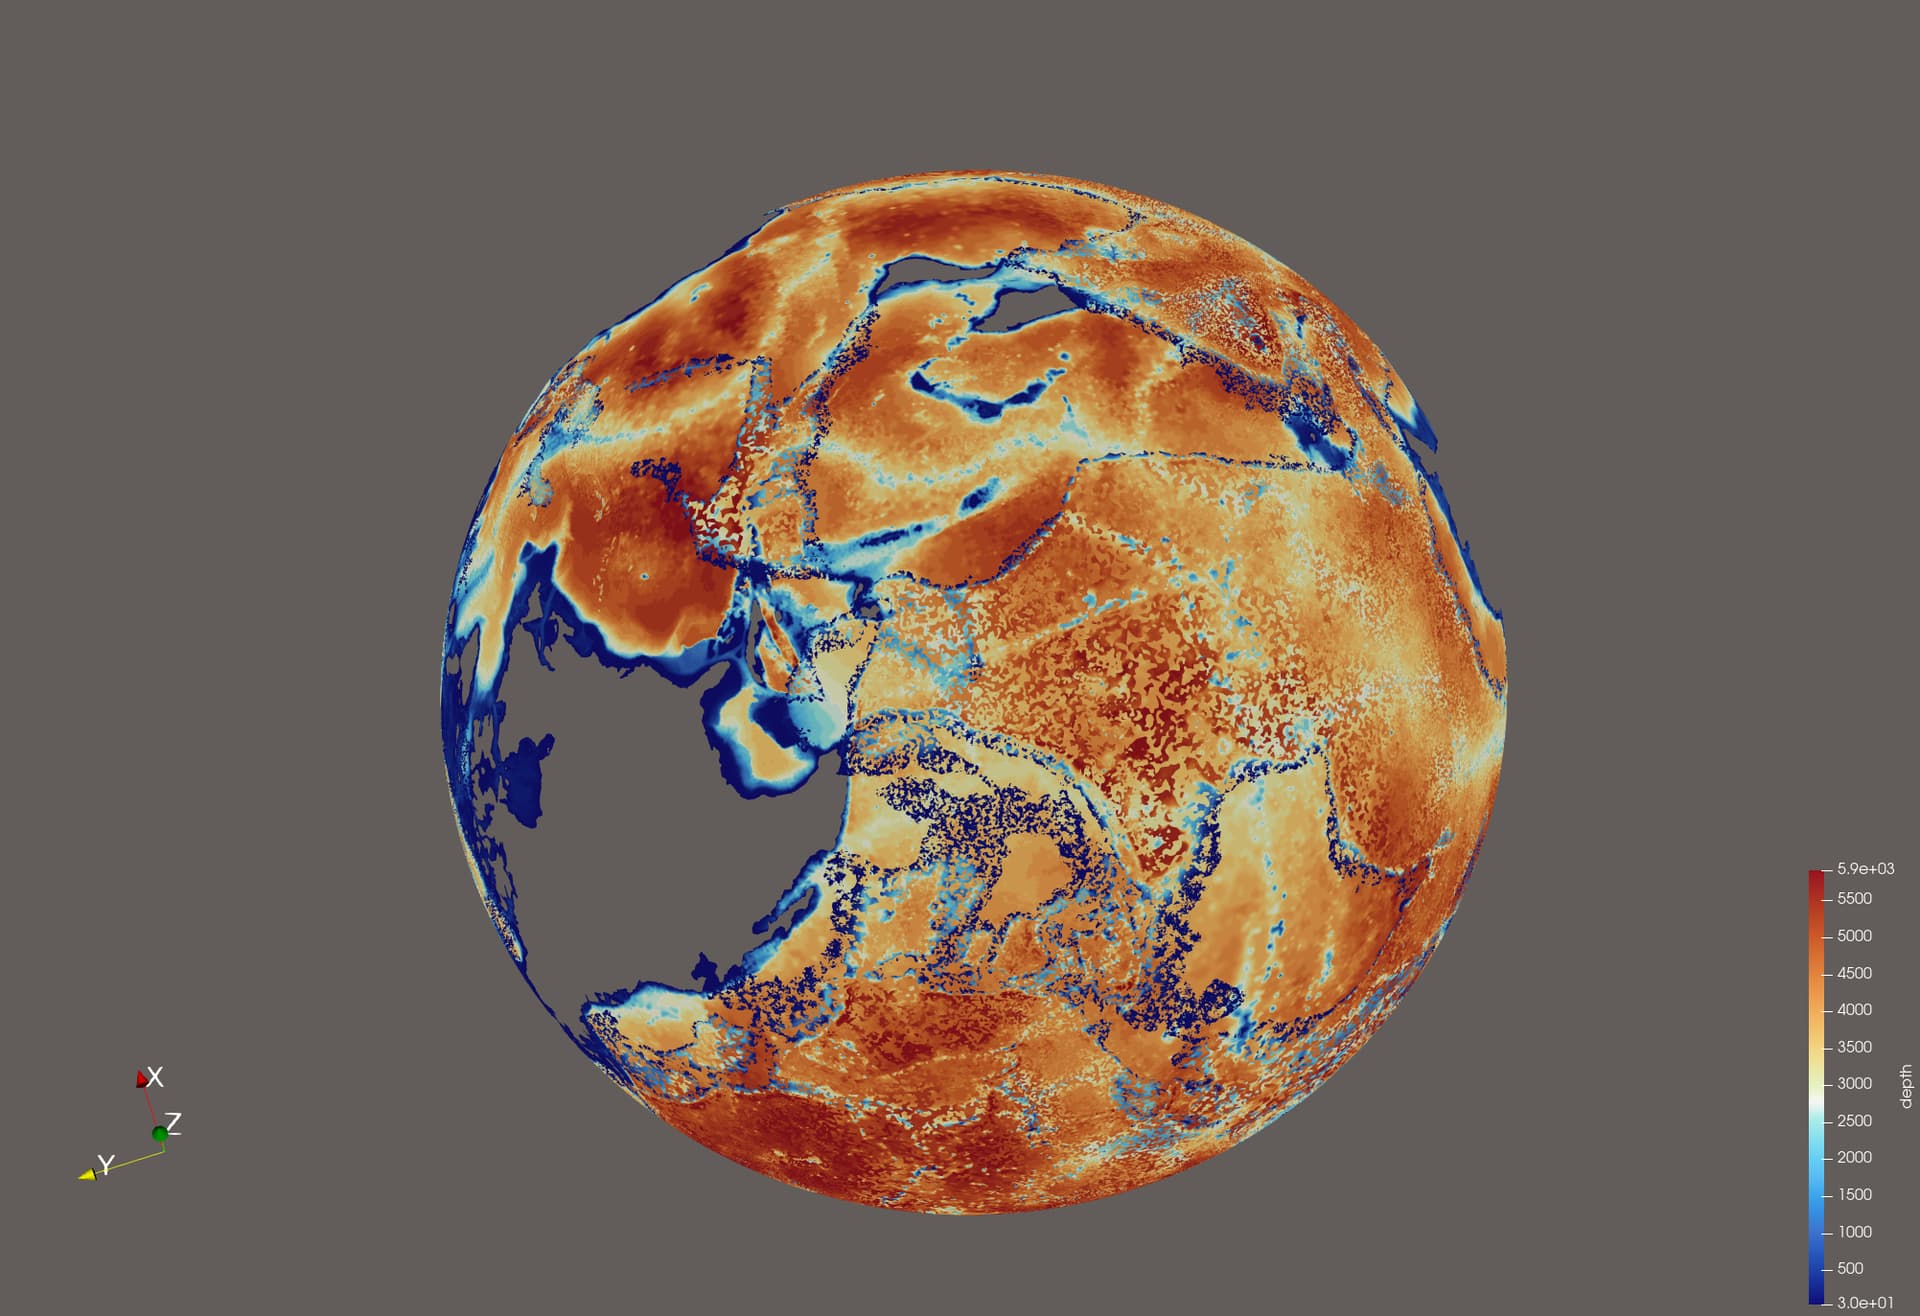
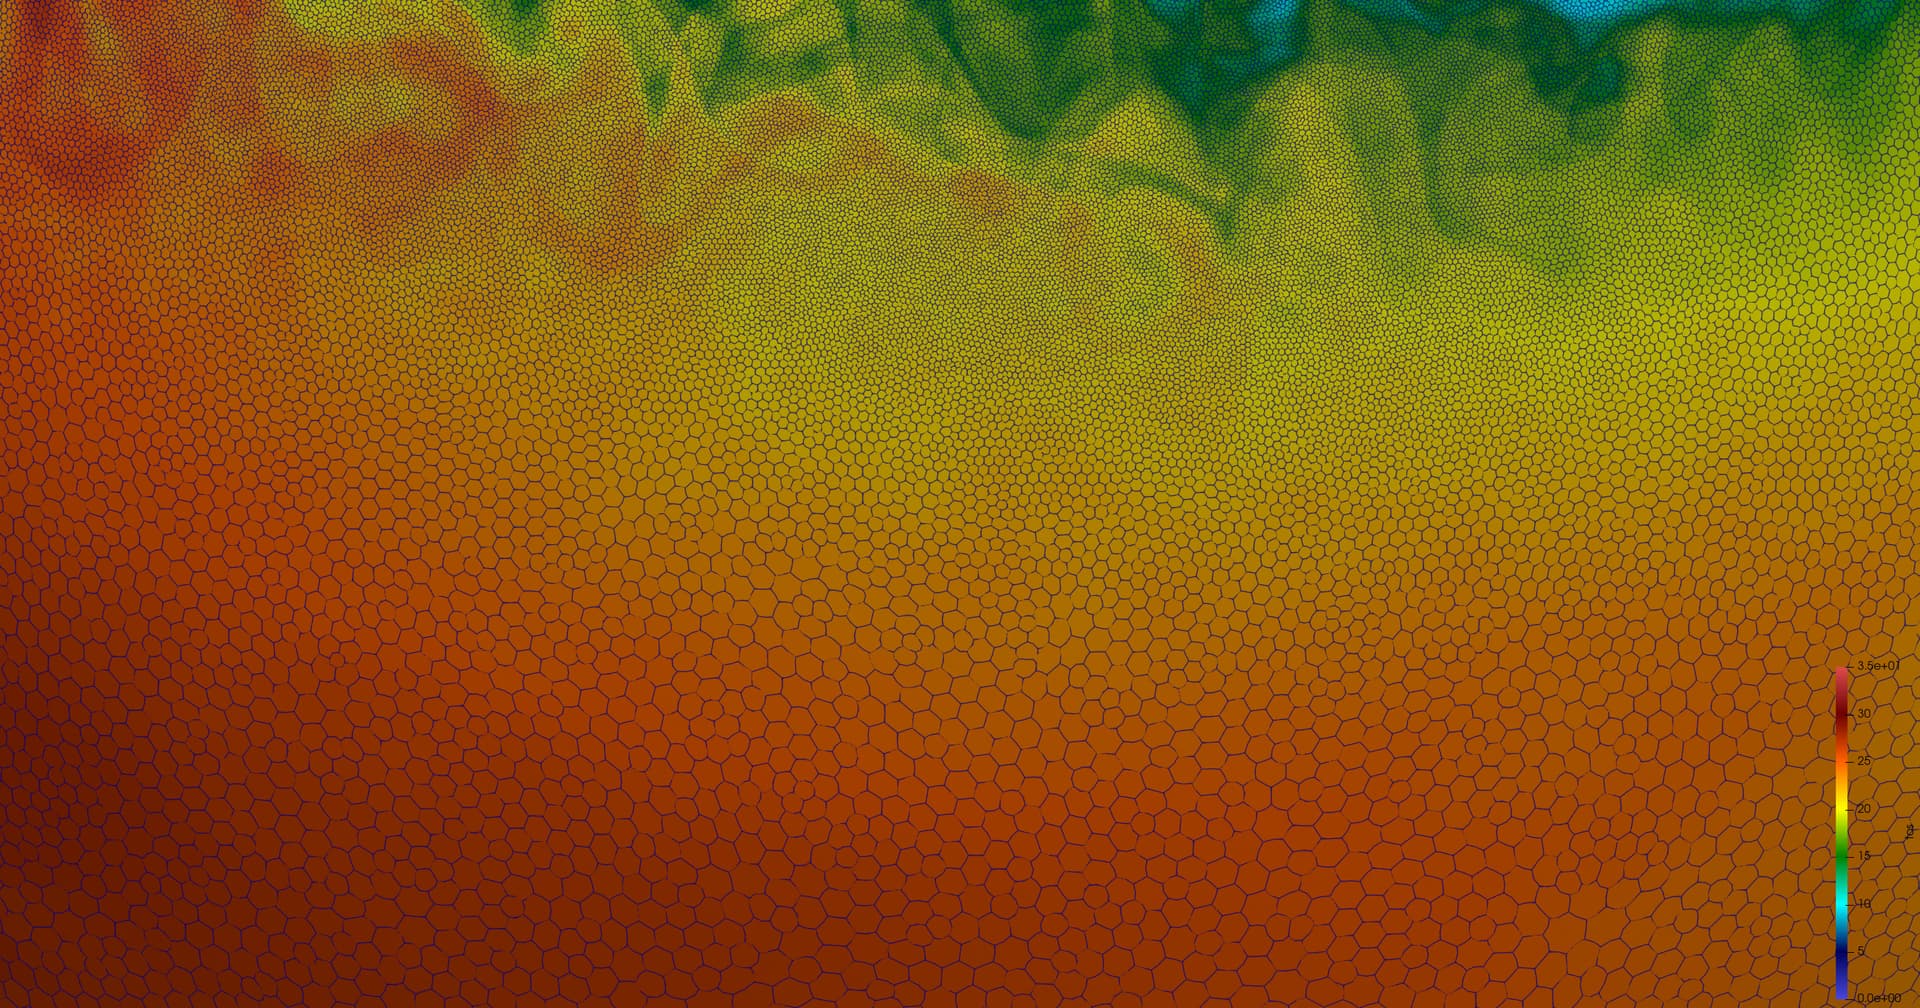
I am not a FESOM expert. However, the FESOM data I got from some colleages at AWI uses a grid that has cells composed of up to 16 vertices. This is what paraview renders.
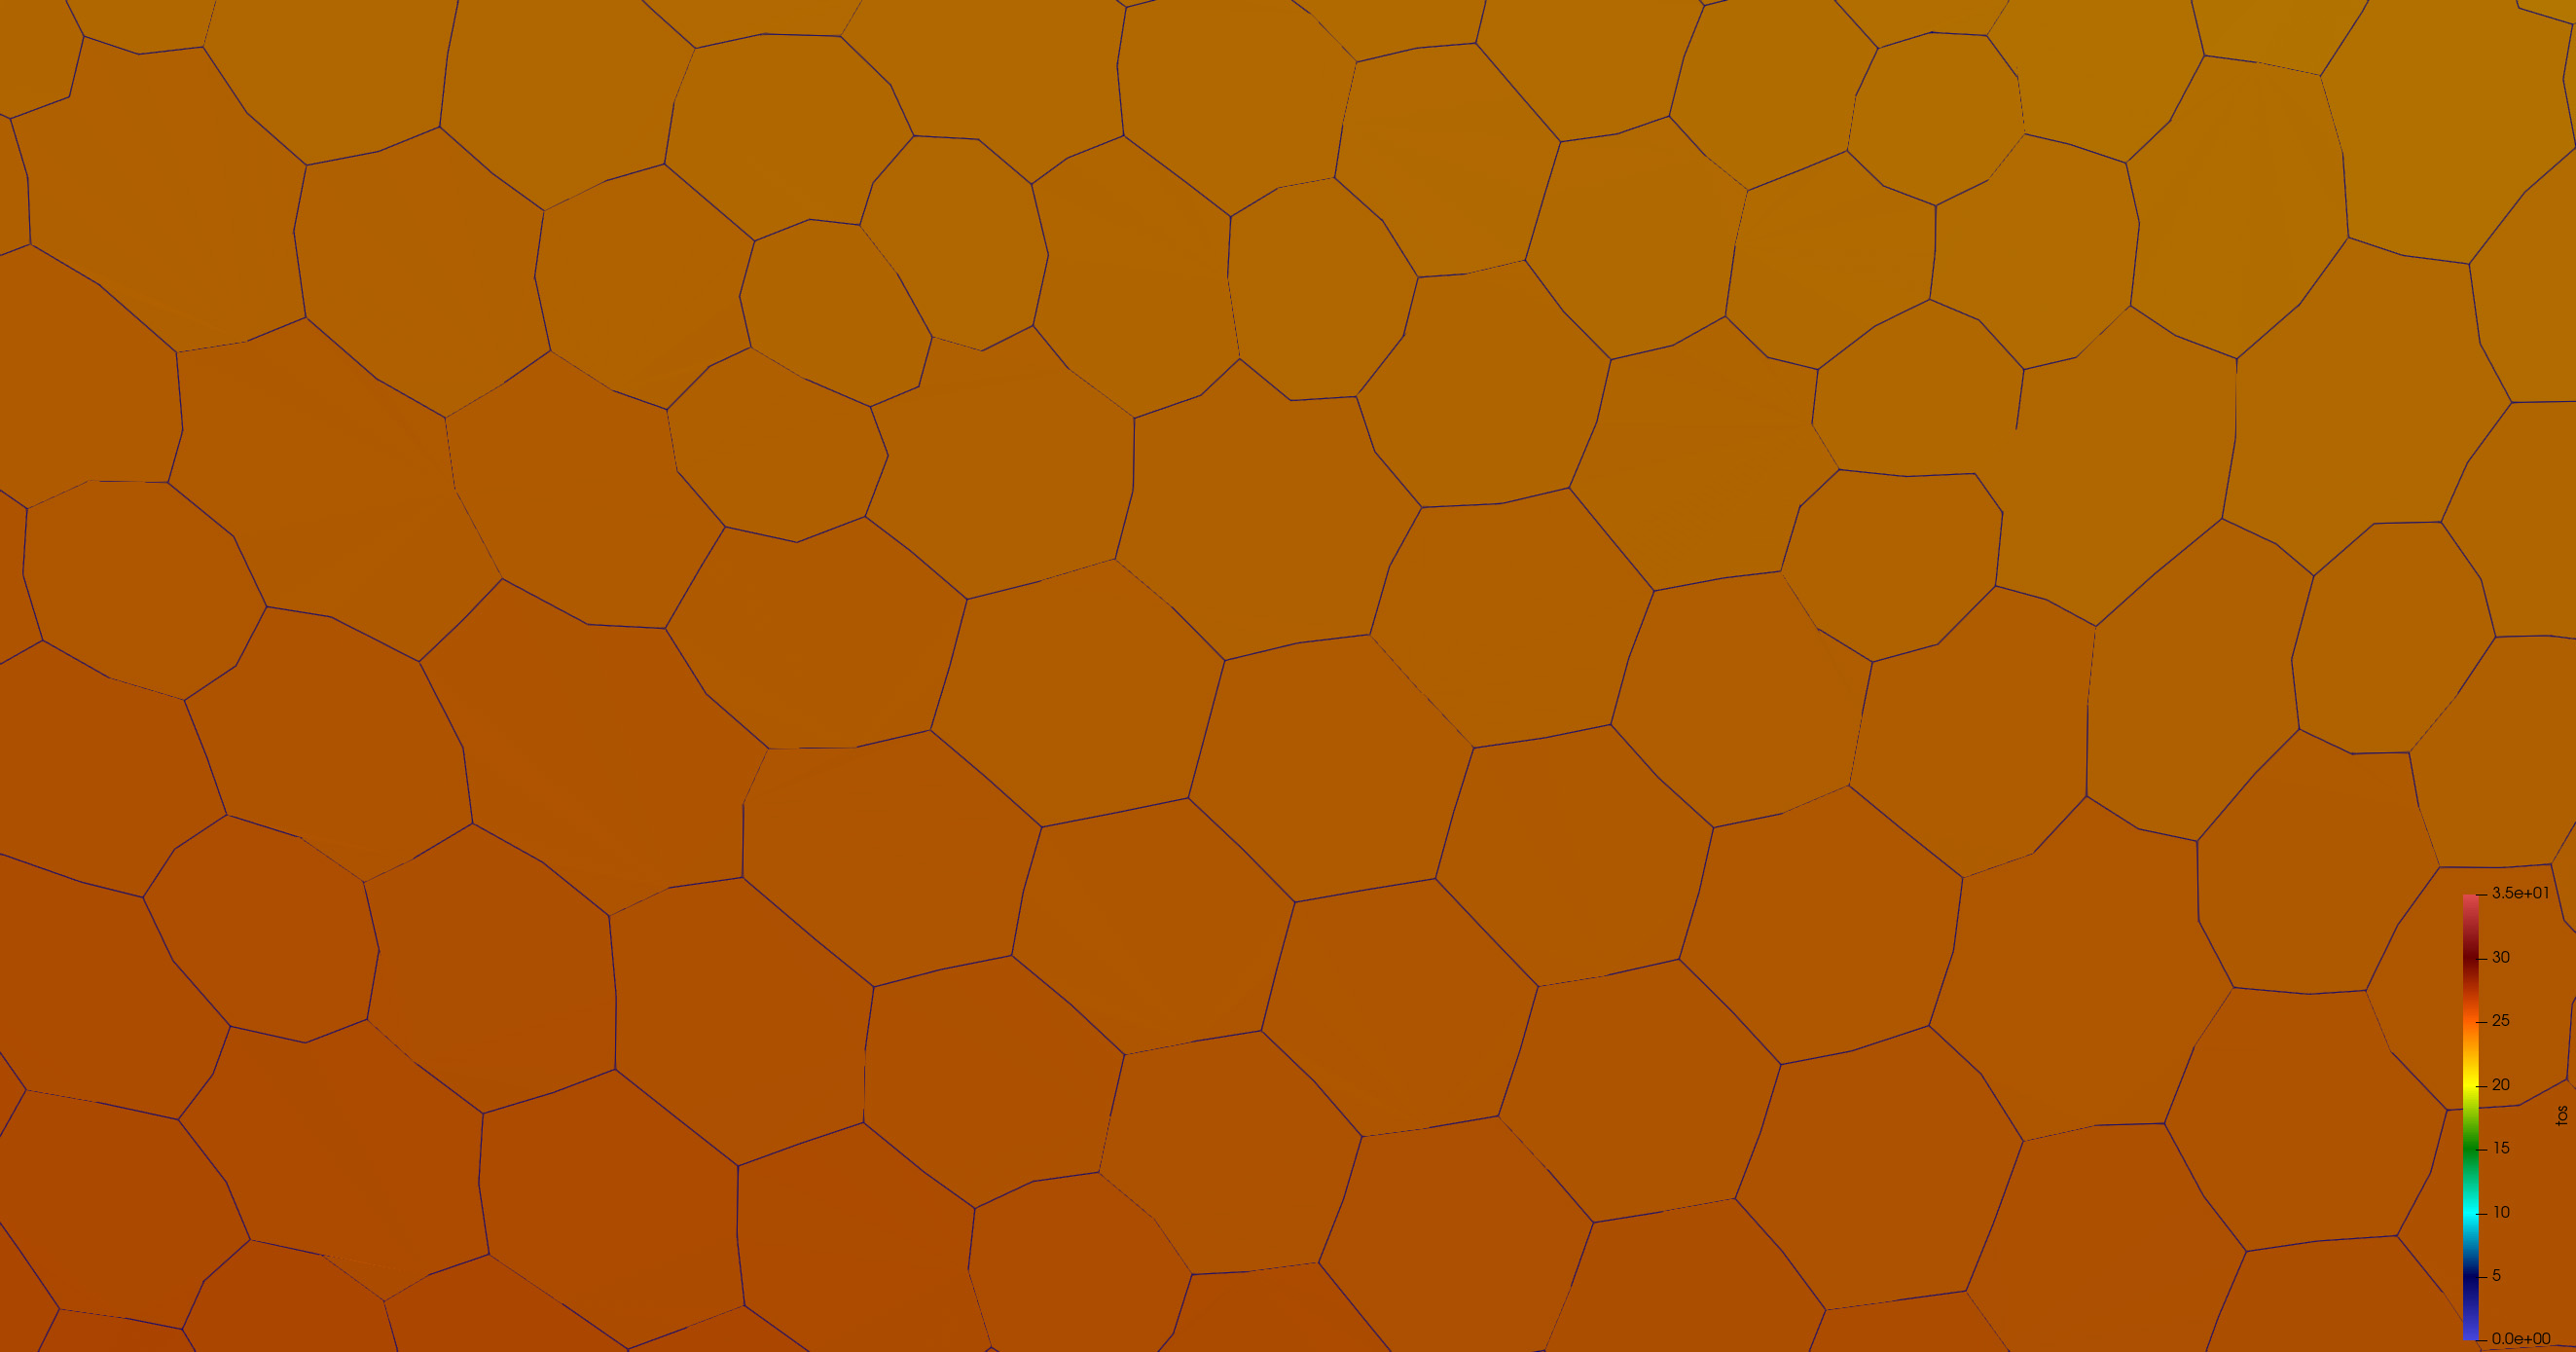
The cells roughly look like hexagons, but when you watch closer, you will see that the shape is much more complicated. However, the triangles those shapes are consisting of seem not to be defined as "cells"in the netcdf file I have.
By the way: the link to your file doesn’t work anymore.
I am not sure what grid they use. The grid that I am using is from FESOM 1.4. The cell elements should be triangles because the elem2d shows that each element is formed by 3 id ncells or vertices. I have uploaded again both files (the netcdf raw and my failed ugr netcdf). The 16 vertices sound the lat_bounds and lon_bounds, showing that vertices could have up to 16 neighbour vertices. I am starting thinking that paraview thinks that the elements are formed by those lat_bounds and lon_bounds. Maybe I misunderstood something.
When you look in the metadata, you will see that deptho is only defined for the cells (which also have 16 vertices). Paraview does the perfectly right thing.
bash-4.4$ ncdump -h fesom_netcdf.nc
netcdf fesom_netcdf {
dimensions:
	ncells = 830305 ;
	vertices = 16 ;
variables:
	float deptho(ncells) ;
		deptho:units = "m" ;
		deptho:_FillValue = 1.e+30f ;
		deptho:missing_value = 1.e+30f ;
		deptho:coordinates = "lat lon" ;
		deptho:standard_name = "sea_floor_depth_below_geoid" ;
		deptho:description = "Ocean bathymetry.   Reported here is the sea floor depth for present day relative to z=0 geoid. Reported as missing for land grid cells." ;
		deptho:cell_methods = "area: mean where sea" ;
		deptho:cell_measures = "area: areacello" ;
	double lat(ncells) ;
		lat:units = "degrees_north" ;
		lat:standard_name = "latitude" ;
		lat:bounds = "lat_bnds" ;
	double lat_bnds(ncells, vertices) ;
	double lon(ncells) ;
		lon:units = "degrees_east" ;
		lon:standard_name = "longitude" ;
		lon:bounds = "lon_bnds" ;
	double lon_bnds(ncells, vertices) ;

// global attributes:
I extruded the data in the negative direction. In addition, I used one of the blue marble images where I cut out the ocean area to fill the “holes”. Finally, the textured sphere needed to be rotated by 180 degrees (z-axis).