Dear All,
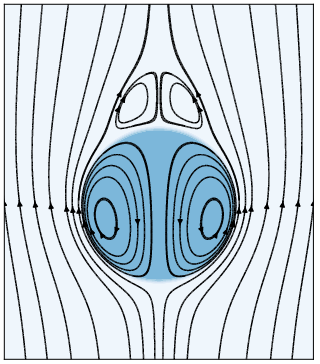
I am trying to plot streamlines into the water droplet. I wanted streamlines given in attachment “paper.png”** where inside and outside droplet streamlines are plotted separately. However when I tried to plot it in paraview, streamlines are passing through two fluid interface, given in attachment “paraview.png”. Is there any way to plot separate streamlines as given in “paper.png”. I am attaching .vtu file for reference.
Yashika D.
IIT Bombay
India
bessel-375.vtu (3.2 MB)
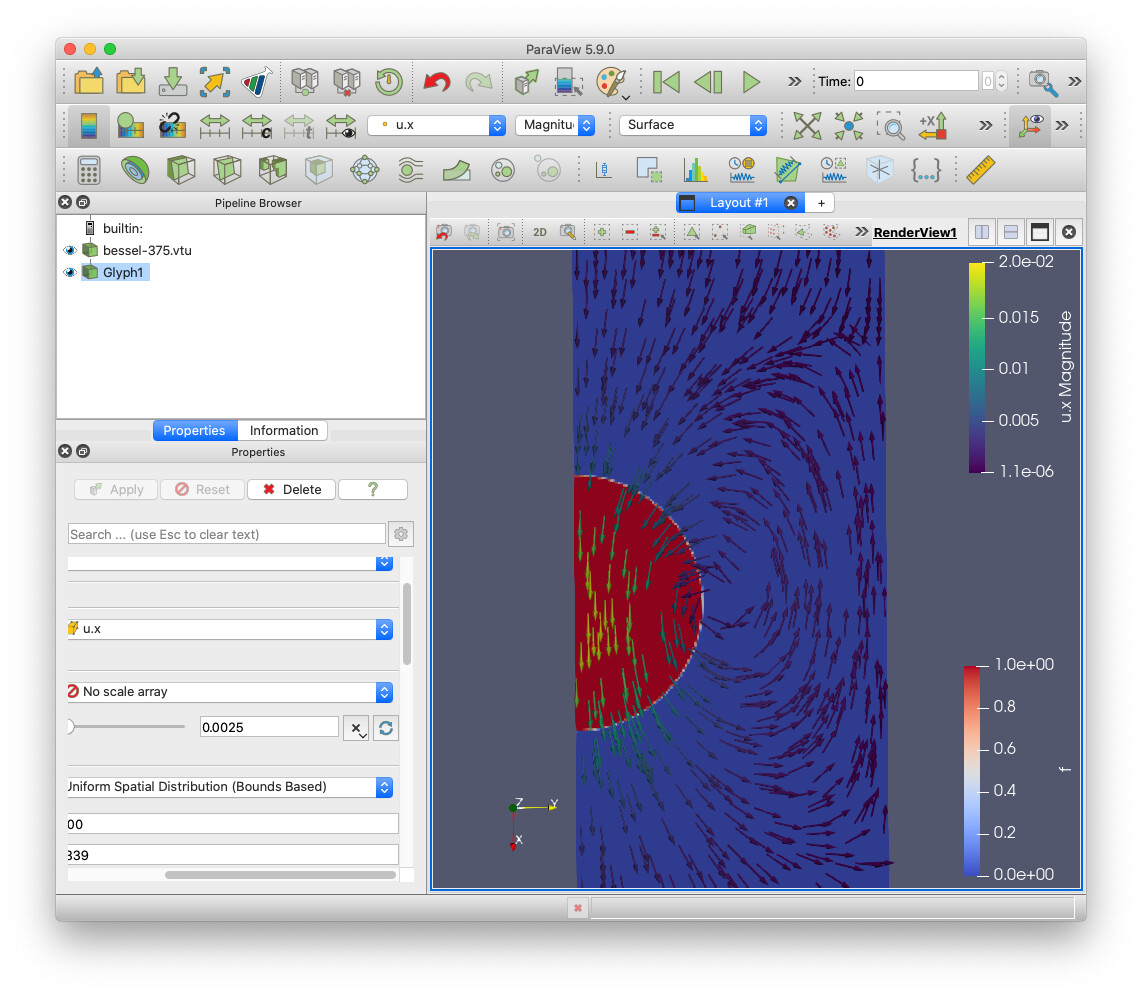
Unfortunately, I think there is something wrong with your data. If you look at the vectors (u.x in your data, you will see that they are not at all pointing in the directions according to your initial image. Here are the vectors plotted directly in a hedgehog visualization using glyphs.
Something must be wrong with how you wrote out the data.
Dear Kenneth,
Thank you very much for a quick reply.
I am using an open source code basilisk “basilisk.fr” for the simulation, in which velocity is recorded at each grid point, It did not record velocities of inside and outside fluids separately. I believe other software like ANSYS also do same. I did other tests on this data like calculation of settling velocity, data is correct.
In theory (first image) I have separate formula for plotting inside and outside velocities. Here, the streamlines can not pass through the two fluid interface, I was thinking if I could plot them separately in paraview as well.
Yashika
I know nothing about basilisk. All I know is what I see in the data you posted. Regardless of whether the velocities of the 2 fluids are recorded together or separately, the direction I observe of the velocities is inconsistent with the physics you describe. For example, the velocity along most of the fluid boundary points perpendicular to the boundary, indicating the flow runs unimpeded through this boundary. Even if you restricted the streamlines to not cross this boundary (which you could do by using the Threshold filter to remove one of the fluids from the data), you would still get the wrong streamline result.
Given the description you say the fluids are supposed to behave, it sounds like either the simulation is not computing as you expect or that something is messing up the data that gets written to this vtu file.
Dear Kenneth and others,
This is with reference to the update on my question.
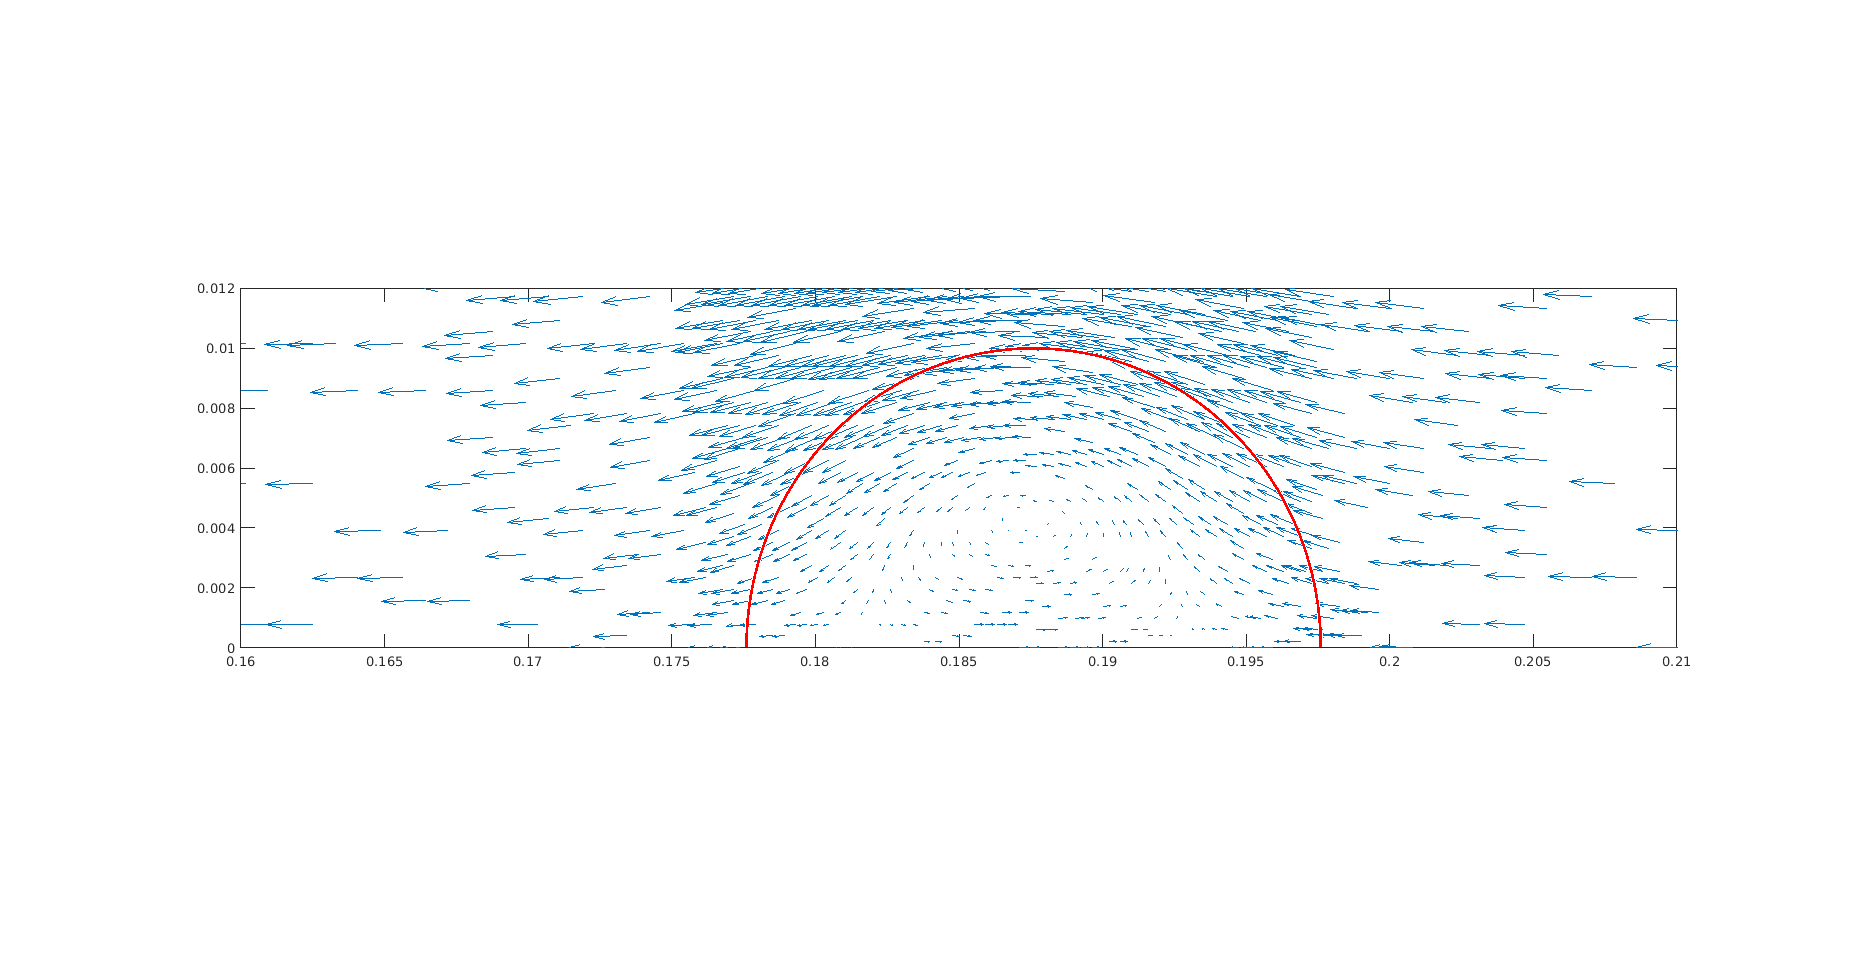
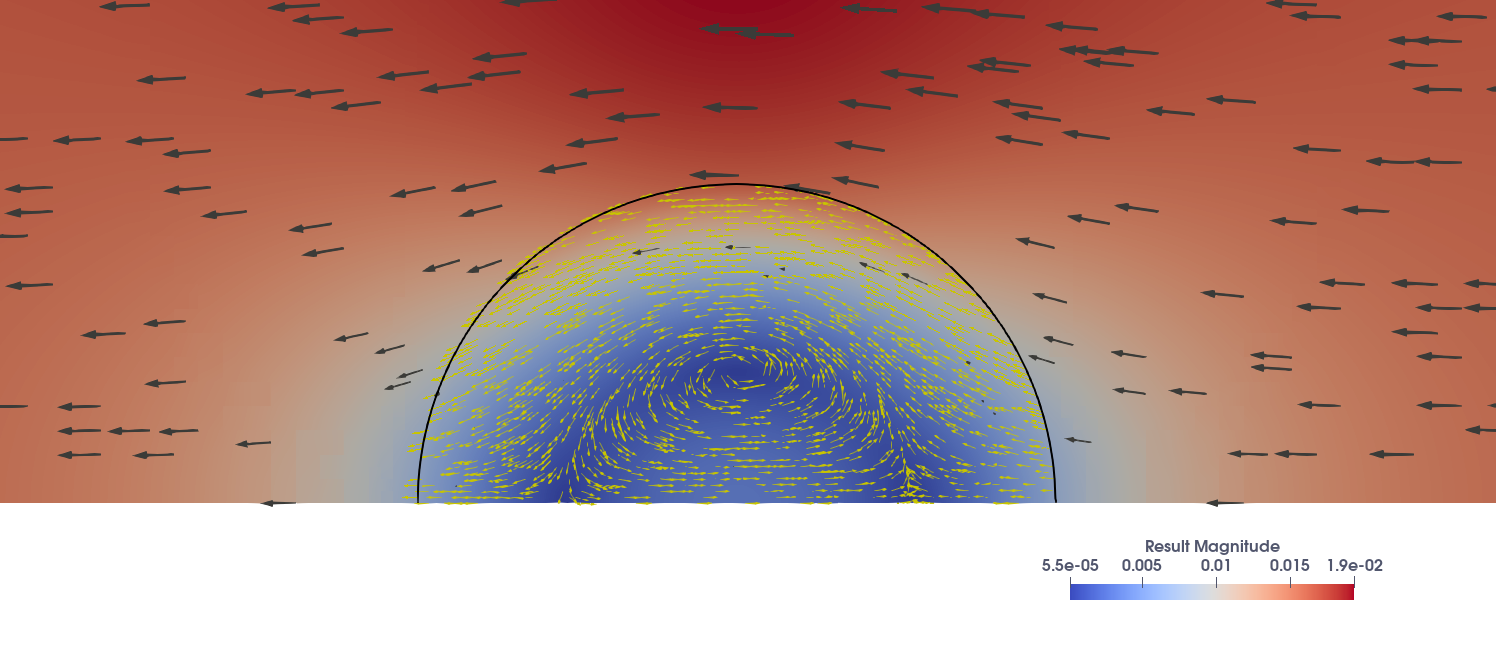
I had to plot these quivers w.r.t center of droplet, because theory is constructed using this assumption. By subtracting velocity vector of droplet center from velocity vector of each grid point and then plotting glyph solves my problem. Sorry I understood it now. I am posting correct matlab and paraview result. Thank you for your support.
Yashika