Hiii… I have to visualize the current density in the benzene molecule (calculation done by GIMIC). I have installed paraview 5.6.0 in windows 10 as well as in Centos 6. I am unable to plot the same in both. I have seen some tutorial in which I have learnt that go to filters and " alphabetical" and select cell data to point data. However, in my paraview, I can see this cell data to point data but it is inactive. Plz, help me regarding the plot of current. Since I have received reviewer comment for my paper it is very urgent.
Thanks
Sharvan,
Welcome to the ParaView community!
I’ve never worked with output from GIMIC, so I might not be able to tell exactly what the problem with your data is. It would help if you could post some example data if possible.
From your description, it sounds like your data does not have cell data. In that case you will not be able to run Cell Data to Point Data because there is nothing to do, and that would explain why it is inactive. To check what kind of data you have, go to the Information tab (on the left usually midway between top and bottom of the window) and look for the Data Arrays box. That will list all the arrays available in your data. Point data will have a dot next to them and cell data will have a cube next to them. If your data already has point data arrays, you probably do not need to run Cell Data to Point Data.
Some Google searches on GIMIC lead me to this documentation page, which has several examples on YouTube: https://gimic.readthedocs.io/en/latest/interpretation.html. There are some videos that demonstrate in ParaView what it sounds like you are trying to do. (I don’t see any of them using Cell Data to Point Data.) If you haven’t yet, it is probably worthwhile to take a look there.
Hii… thank you for your reply.
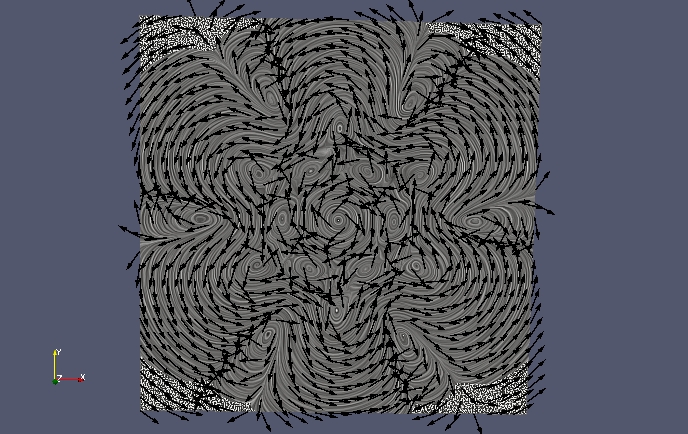
I have all the files, Plz, see the attached files and tell me why I am not getting the results. I have to plot like (see the attached jpg file) for my molecule using the given files.
jvec.vti (51.7 KB)
mol-bohr.cml (9.67 KB)
state-file.pvsm (476 KB)
mol.cml (8.89 KB)
OK. Here are the steps I think will do what you want.
- The swirly lines on the plane look like they are made with the Surface LIC plugin. That plugin is not loaded by default, but it is easy to load.
- Go to
Tools->Manage Plugins....
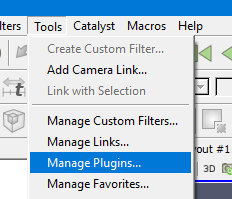
- Click the
SurfaceLICplugin and then clickLoad Selected. - If you see both
Remote PluginsandLocal Plugins, loadSurfaceLICin both places. - You might also want to click the + next to
SurfaceLICand click on theAuto Load. That will makeSurfaceLICautomatically load the next time you start ParaView.
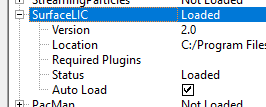
- Click
Closewhen you are done.
- Go to
- Load the
jvec.vtifile. ClickApply. - Add the
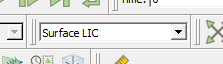
Extract Surfacefilter. ClickApply. (This filter will convert the 2D uniform grid to polygons. This is because theSurfaceLICplugin will not work directly with the 2D unform grid.) - Change the representation from
SurfacetoSurface LIC.
- Add the
Glyphfilter. ChangeOrientation Arraytovectors. ChangeScale Factorto1.Apply. - In your image it looks like the arrows are colored black. Click the edit colors button
 and select the color you want.
This is a state file I created following these instructions. A screen shot from this state file is below.
lic-with-glyphs.pvsm (419.2 KB)

Dear Kenneth Moreland,
Thank you so much for your help. Now I am able to make the figures which I need. However, I am not able to change the color of the vectors and surface LIC. in my figure the vector colors are blue and surface LIC is gray so they don’t look as good as yours. Plz, tell me the color changing options and also the options to change the thickness of the vectors.
Thank you.
Colors of objects in your visualization are controlled by the widgets in the second toolbar.
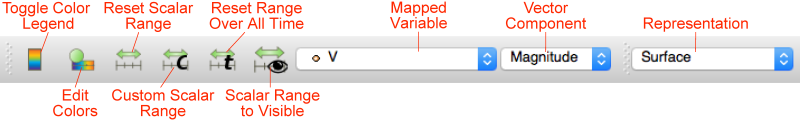
Just select the corresponding object in the Pipeline Browser and then use these widgets to select which array you want to color by (or a solid color if you don’t want to color by any array) and use the Edit Colors as needed.
If you have not had a chance yet, I suggest taking a look at the getting started guide (Help -> Getting Started with ParaView) to get yourself familiar with some of the basics of using ParaView. It is a short 9 step exercise that will help you understand some of the basic concepts of ParaView. When you have more time, you might also want to go through the tutorial (Help -> ParaView Tutorial) to learn even more concepts.
Dear Kenneth,
Thank you so much for your help. Now I can change the colours.
I will follow your suggestions.