Rem
October 16, 2019, 9:02am
1
Hi all,
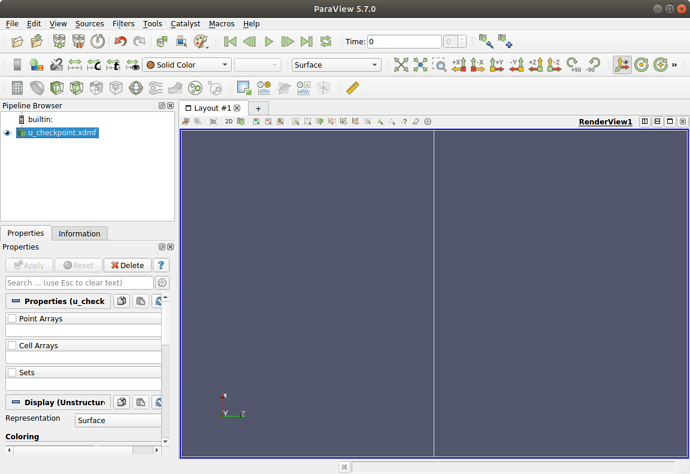
I’m writing xdmf files with checkpointing with FEniCS. everything works fine in 2D/3D, but 1D fields cannot be visualise in Paraview 5.7 (nor in the previous versions).
Here’s an exemple file:u_checkpoint.h5 (7.7 KB) u_checkpoint.xdmf (1.2 KB)
Does anyone has an idea ?
Thanks in advance!
Rem
mwestphal
October 17, 2019, 2:37am
2
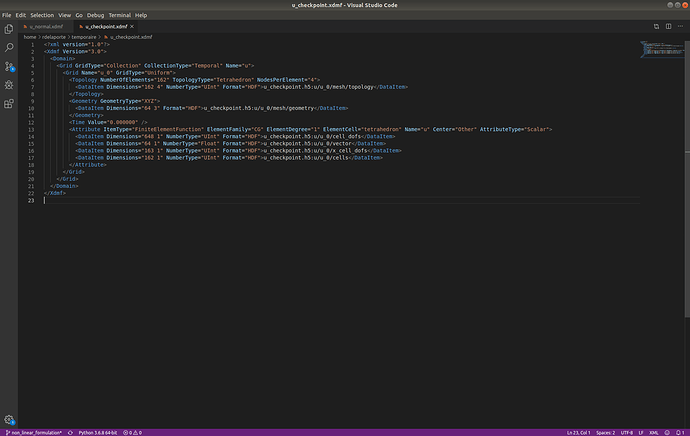
the Center="Other" attribute in your xdmf file is not supported.
Rem
October 17, 2019, 7:42am
3
thanks for the reply. how can I check if this attribute is also present in these files ? (these files have been generated with the same FEniCS function but in 3D)
I’d like to know if it’s a FEniCS issue
u_checkpoint.h5 (16.0 KB) u_checkpoint.xdmf (1.2 KB)
mwestphal
October 17, 2019, 7:51am
4
You can check by reading the .xdmf file.
Rem
October 17, 2019, 7:54am
5
Cheers. It appears that there is indeed an Center="Other" attribute in this xdmf file.u_checkpoint.h5 (16.0 KB) u_checkpoint.xdmf (1.2 KB)
Yet it’s readeable in Paraview. It must be supported then
mwestphal
October 17, 2019, 7:59am
6
My bad, the warning I was seeing was a red herring.
Actually, your first file seems to load fine, it just contains 3 cells and 4 points;
Rem
October 17, 2019, 8:18am
7
I can load but I can’t plot over line.
This is the message I get when loading with paraview
“Finite element function of family CG and degree 1 on Polyline is not supported.
Unable to get number of points for cell type 0”
mwestphal
October 17, 2019, 8:55am
8
The message is quite self explanatory. Your dataset contains only a line. You can’t plot over line when your dataset is only a line.
Rem
October 17, 2019, 8:59am
9
Yes I understand that, yet I’ve been able to plot over line with a line dataset before.
See this example :
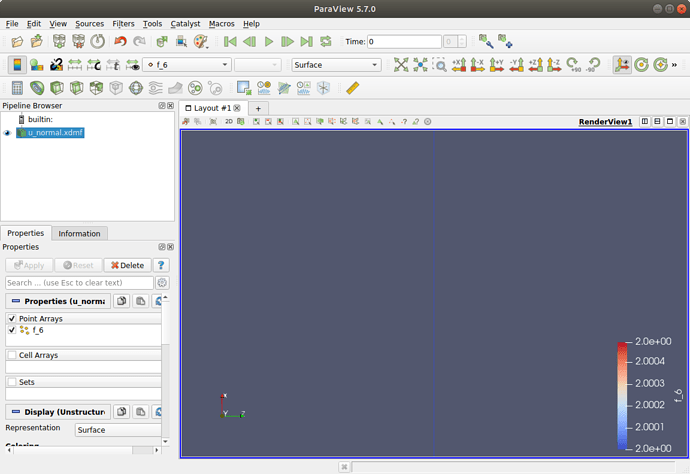
Same data, generating without checkpointing though. But i’m able to plot over line even though it’s a 1D dataset.
u_normal.h5 (6.9 KB) u_normal.xdmf (660 Bytes)
mwestphal
October 17, 2019, 9:08am
10
My bad, the reason because you can’t plot over line your first dataset is because it does not contains any data, only geometry.
Rem
October 17, 2019, 11:13am
11
I’m afraid it does have data in it since I’m able to import it and use it in a FEniCS script.
mwestphal
October 17, 2019, 11:43am
12
The data is ignored because of the Center="Other" attribute
Rem
October 17, 2019, 11:49am
13
How come in the 3D case, where the attribute Center="Other" is also present, visualisation is possible ?
mwestphal
October 17, 2019, 11:57am
14
No idea, this would require investigation. In any case, the bug is in ParaView/VTK side, not FEniCS.
1 Like
Rem
March 11, 2021, 1:48pm
15
Hi Mathieu, this bug still occurs in the latest version of Paraview. Any update on the matter ?
Cheers
mwestphal
March 11, 2021, 1:49pm
16
Not that I’m aware of. You may want to test with master and then, is the issue still present, open an issue on https://gitlab.kitware.com/paraview/paraview/-/issues .
Rem
March 11, 2021, 2:13pm
17
Rem
May 19, 2021, 1:43pm
18
Hi Mathieu, any chance there’s an update on this bug?
Cheers,


