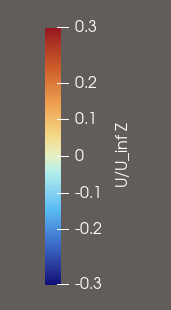
I have noticed that the tick marks on my scalar bar do not appear to be equally spaced, even though the numerical intervals between them are the same.
For example, in the attached screenshot the scalar range is from -0.3 to 0.3, with labels at intervals of 0.1. However, the distance between 0.2 and 0.3 is larger than the distance between 0.1 and 0.2 (and the same for their negative values).
Since the colour scale is linear, I would expect equal numerical intervals to have equal physical spacing on the scalar bar.
Is this expected behaviour? If so, is there a way to force the tick marks to be positioned at equally spaced values, for example at exactly -0.3, -0.2, -0.1, 0, 0.1, 0.2, and 0.3?
One extra question: is it possible to have different ranges for different components of the same variable (eg. X, Y and Z components of velocity)?
Are -0.3 and 0.3 really those values or are they rounded based on the formatting you have for the range labels (Range Label Format setting)? Click Rescale to Custom Data Range to see what the actual range values are.
Sorry, you are right. I completely forget I was using only one decimal place and, in this specific case, the range values were -0.35 to 0.35.
Regarding the other question: is it possible to have different ranges for different components of the same variable (eg. X, Y and Z components of velocity)?
Unfortunately, not directly. You could extract individual components with Extract Component at the cost of memory duplication and color by the extracted component. That will have a different color legend with a range you can set separately.