Hi guys,
I am new to the paraview discourse group, I hope that this is the right place to ask this question.
I use FEniCS to generate several pvd files like
cfile_pvd_epsilon1.0 = File(“sol-eps1_0.pvd”)
cfile_pvd_epsilon1.0 << c_sol1_0
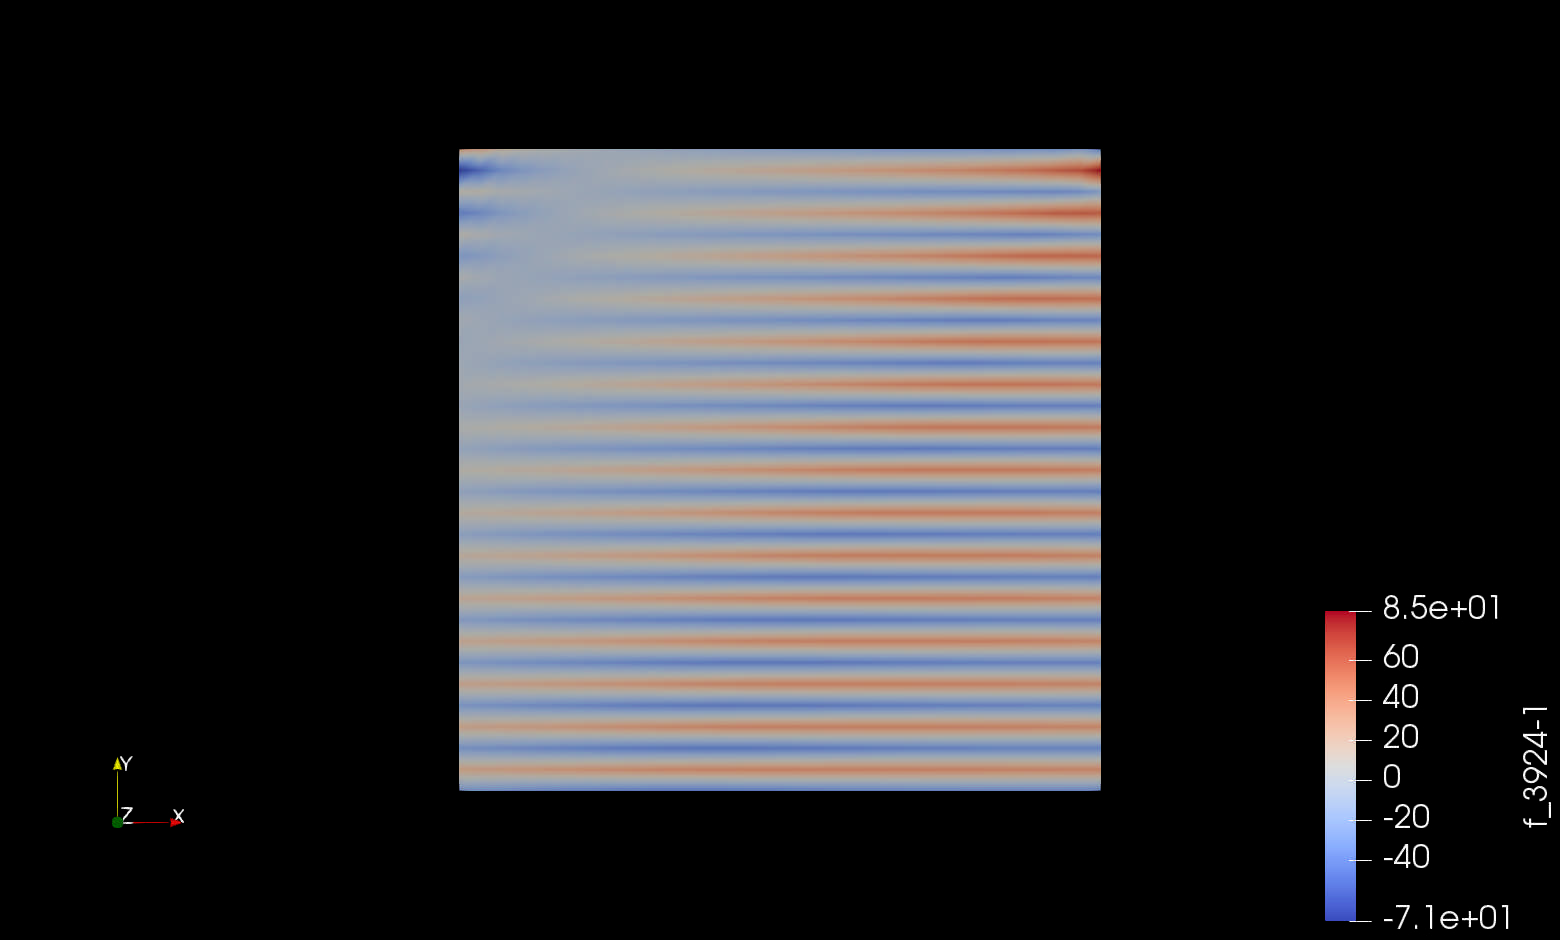
Hi, thanks for considering my question. What I need is to be able to have the exact same scale and both of these graphs. Right now on one of them the shade “most red” means 8.5e+01, on the other one it means 6.7e+01. (I didn’t set them to anything, Paraview came up with this values itself - I don’t know how to set these values) How can I make sure I have a scaling that is uniform, or one that I can select?
Thanks so much!