Hi all,
When I visualize a ‘Slice’ in ParaView and enable “Surface with Edges/Wireframe” to show the mesh around the wing of an aircraft, I see unexpected curved or diagonal lines in the interior of the domain. These lines do not correspond to actual grid lines and appear to be artifacts overlaid on the slice.
I am using structured grid data, and the goal is to view the mesh lines only — without these extra visual features. Why is this happening, and how can I display only the actual mesh edges on the slice?
Thanks in advance!

Assuming your data is 1) volumetric in origin and 2) curvilinear (grid lines are not exclusively oriented with the X, Y, or Z axes), my best guess is that you are seeing results of the plane crossing over grid cells that are curvilinear in the direction through which you took your slice. However, if that were the case there should be more visible changes to the grid resulting from the triangulation process around the curved edges in question, so something else might be going on.
Is it possible for you to share this data or a similar dataset that exhibits the same problem?
Hello,
Yes, the grid is volumetric and curvilinear. I have attached a dataset that have the same grid. Could you please check the attached link? Thank you very much! https://drive.google.com/drive/folders/1YdkZvMps9U8kE5Eo64g8F2hssK7A7r16?usp=sharing
Thank you, @Daluar I was able to download the data and load it. Could you tell me the Origin and Normal properties of the plane you created above? If it’s easier, please share a ParaView state file that created the image of the Slice in your original post.
mesh_at_y254.pvsm (334.3 KB)
Here is the state file… I created the slice at (2420, 254,0) and normal to Y axis. Actually, I created images at multiple y locations along the wingspan. When I move toward the wing tip, it improves near the wing (less unwanted curve lines).
Thanks for sharing your state file.
Some of the blocks curve with respect to your Slice’s plane, that is, they aren’t perfect aligned with the slice plane and the curves you see are the boundary between one layer and the next in the direction of the Slice normal. This is maybe not the best attempt to show what’s happening, but best I could come up with relatively quickly.
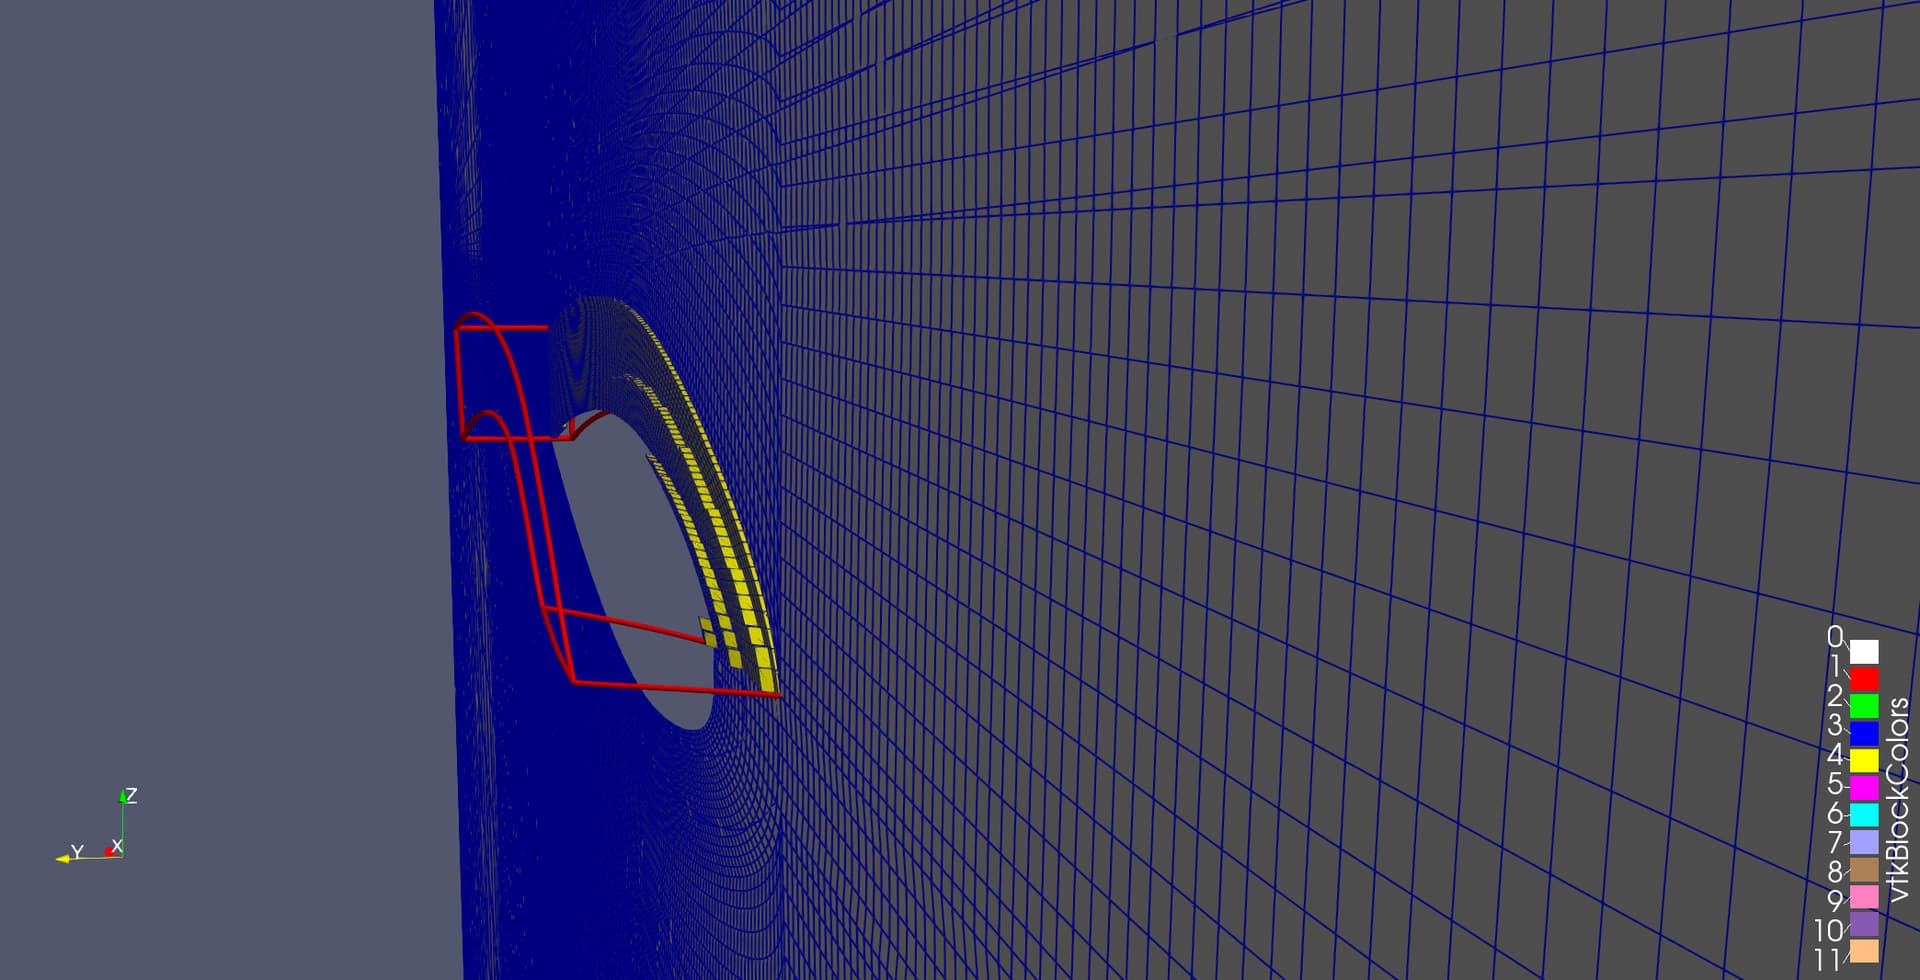
- The blue grid is from the Slice at (2420, 254, 0) and normal to the Y axis.
- The red surface is the outline of Block-124.
- The yellow surface is a crinkle cut Slice at (2420, 254, 0) and normal to the Y axis. Crinkle cut means it includes any cell that intersects that plane.
You can see there are four layers of cells in the yellow surface that intersect with the plane. The curves you see are the transition of the slice from one layer to the next - they are real in the sense that when you slice each of these layers, there is a boundary between the results, and that is what you are seeing as the curves.
Thank you very much for your time. I understand the issues clearly. It will help me !!