Mathieu,
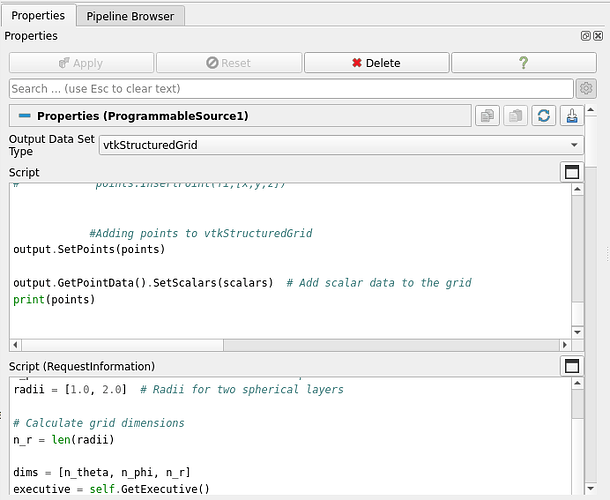
Oh boy. I just found out there was a second script window (RequestInformation) that
was completely hidden below the Information View !
Now that I split the code in two parts:
Script:
import numpy as np
from vtkmodules.vtkCommonCore import vtkPoints, vtkDoubleArray
from vtkmodules.vtkCommonDataModel import vtkStructuredGrid

# Parameters
n_theta = 18    # Number of divisions in the theta direction
n_phi = 36      # Number of divisions in the phi direction
radii = [1.0, 2.0]  # Radii for two spherical layers

# Calculate grid dimensions
n_r = len(radii)

executive = self.GetExecutive()
outInfo = executive.GetOutputInformation(0)
exts = [executive.UPDATE_EXTENT().Get(outInfo, i) for i in range(6)]
dims=[exts[1]+1, exts[3]+1, exts[5]+1]
output.SetExtent(exts)

#vtk points
points = vtk.vtkPoints()
points.Allocate(dims[0] * dims[1] * dims[2])
scalars = vtkDoubleArray()
scalars.SetName("Radius")  # Name of the scalar field

# Define spherical coordinates and convert them to Cartesian
for ir in range(n_r):
    r=radii[ir]
    for theta_idx in range(n_theta):
        theta = theta_idx * np.pi / (n_theta - 1)
        for phi_idx in range(n_phi):
            phi = phi_idx * 2 * np.pi / (n_phi - 1)

            x = r * np.sin(theta) * np.cos(phi)
            y = r * np.sin(theta) * np.sin(phi)
            z = r * np.cos(theta)

            fi = ir*n_theta*n_phi+theta_idx*n_phi+phi_idx # Flat index
            points.InsertPoint(fi,[x,y,z])
            print(fi)
#            points.InsertNextPoint(x, y, z)
           # Add the scalar value (e.g., radius here)
            scalars.InsertNextValue(r)

#Adding grid points                                                                                                                                                                                           #for iz, z in enumerate(zs):
#    for iy, y in enumerate(ys):
#        for ix, x in enumerate(xs):
#            fi = iz*len(xs)*len(ys)+iy*len(xs)+ix # Flat index
#            points.InsertPoint(fi,[x,y,z])


            #Adding points to vtkStructuredGrid
output.SetPoints(points)

output.GetPointData().SetScalars(scalars)  # Add scalar data to the grid
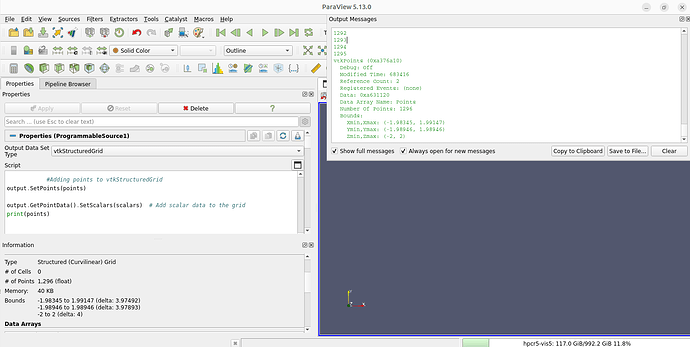
print(points)
Script(RequestInformation):
# Parameters
n_theta = 18    # Number of divisions in the theta direction
n_phi = 36      # Number of divisions in the phi direction
radii = [1.0, 2.0]  # Radii for two spherical layers

# Calculate grid dimensions
n_r = len(radii)

dims = [n_theta, n_phi, n_r]
executive = self.GetExecutive()
outInfo = executive.GetOutputInformation(0)
outInfo.Set(executive.WHOLE_EXTENT(), 0, dims[0]-1 , 0, dims[1]-1 , 0, dims[2]-1)
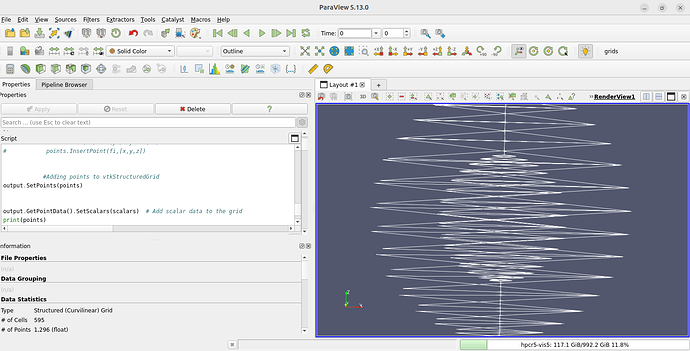
I get the Outline representation immediately !
This will take some time to get used to.
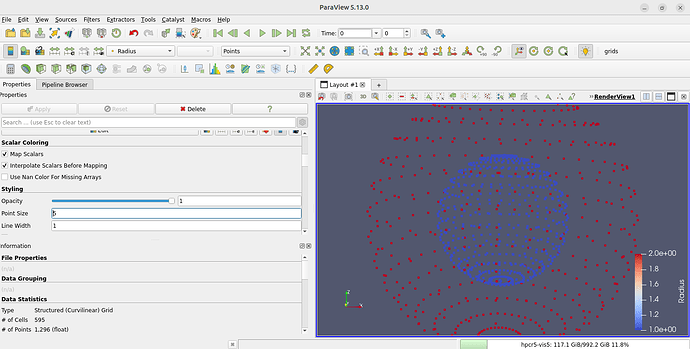
Is there a way to programmatically set the Representation (to Points instead of Outline) , Coloring by scalar (“Radius”) and set the Point Size to say, 5 ?
To reuse the Source I suppose the next step would be to create a python plugin following Section 5.5 in
https://docs.paraview.org/en/latest/ReferenceManual/pythonProgrammableFilter.html#python-algorithm
?
Thanks,
JM
