Hi,
is there a way to use block names in the legend instead of the default (block = 1), (block = 2), etc…
Best,
Jérémie
Hi,
is there a way to use block names in the legend instead of the default (block = 1), (block = 2), etc…
Best,
Jérémie
Hi,
Here’s an example
example.zip (36.6 KB)
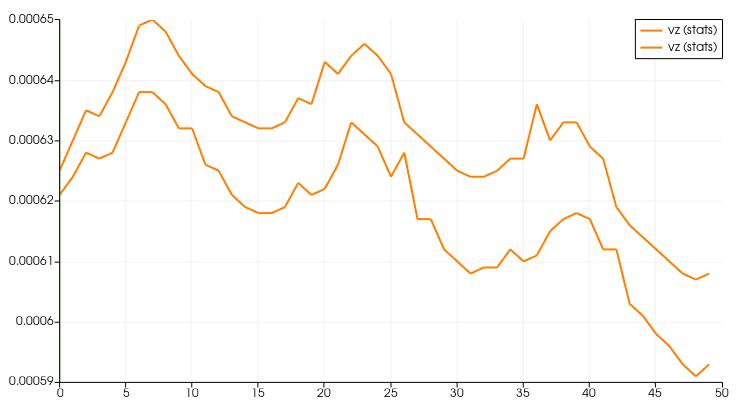
I would like to plot the the velocity component “vz” over time, contained in the col-cds files, for both cases (with and without force) on the same graph. Ideally with a legend that has something like vz (with force) and vz (without force).
If I import each sequence of files and plot, I cannot differentiate the two graphs in the legend:
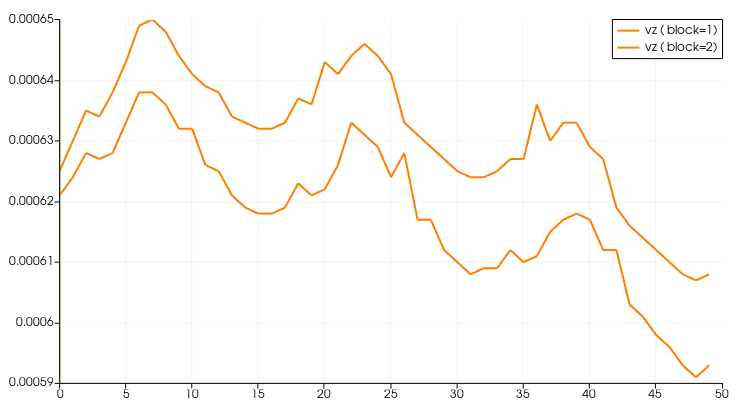
If I group them I can only show the number of the block in the legend:
Best,
Jérémie
Hi @Jeremie
In ParaView 5.11, GroupDataSets lets you rename the blocks if you want to, this should fix your issue.
Best,
That’s good to hear. I will update to version 5.11
I am still not sure how to have with two different colors for each vz, in a way that is consistent, from a single color palette rather than 2 different color palettes.
Best
Jérémie
Hi @mwestphal
I have downloaded Paraview 5.11. It is indeed possible to change the block names but the name on the legend are still “block = 1” etc…
Best,
Jérémie
It is working great here, please share your data
This is caused by PlotSelectionOverTime. You want to Plot Over Time first, two times, and then use GroupDataSet.
That being said, PlotOverTime should not rename block like that, this is an issue that should be fixed, feel free to open it: https://gitlab.kitware.com/paraview/paraview/-/issues
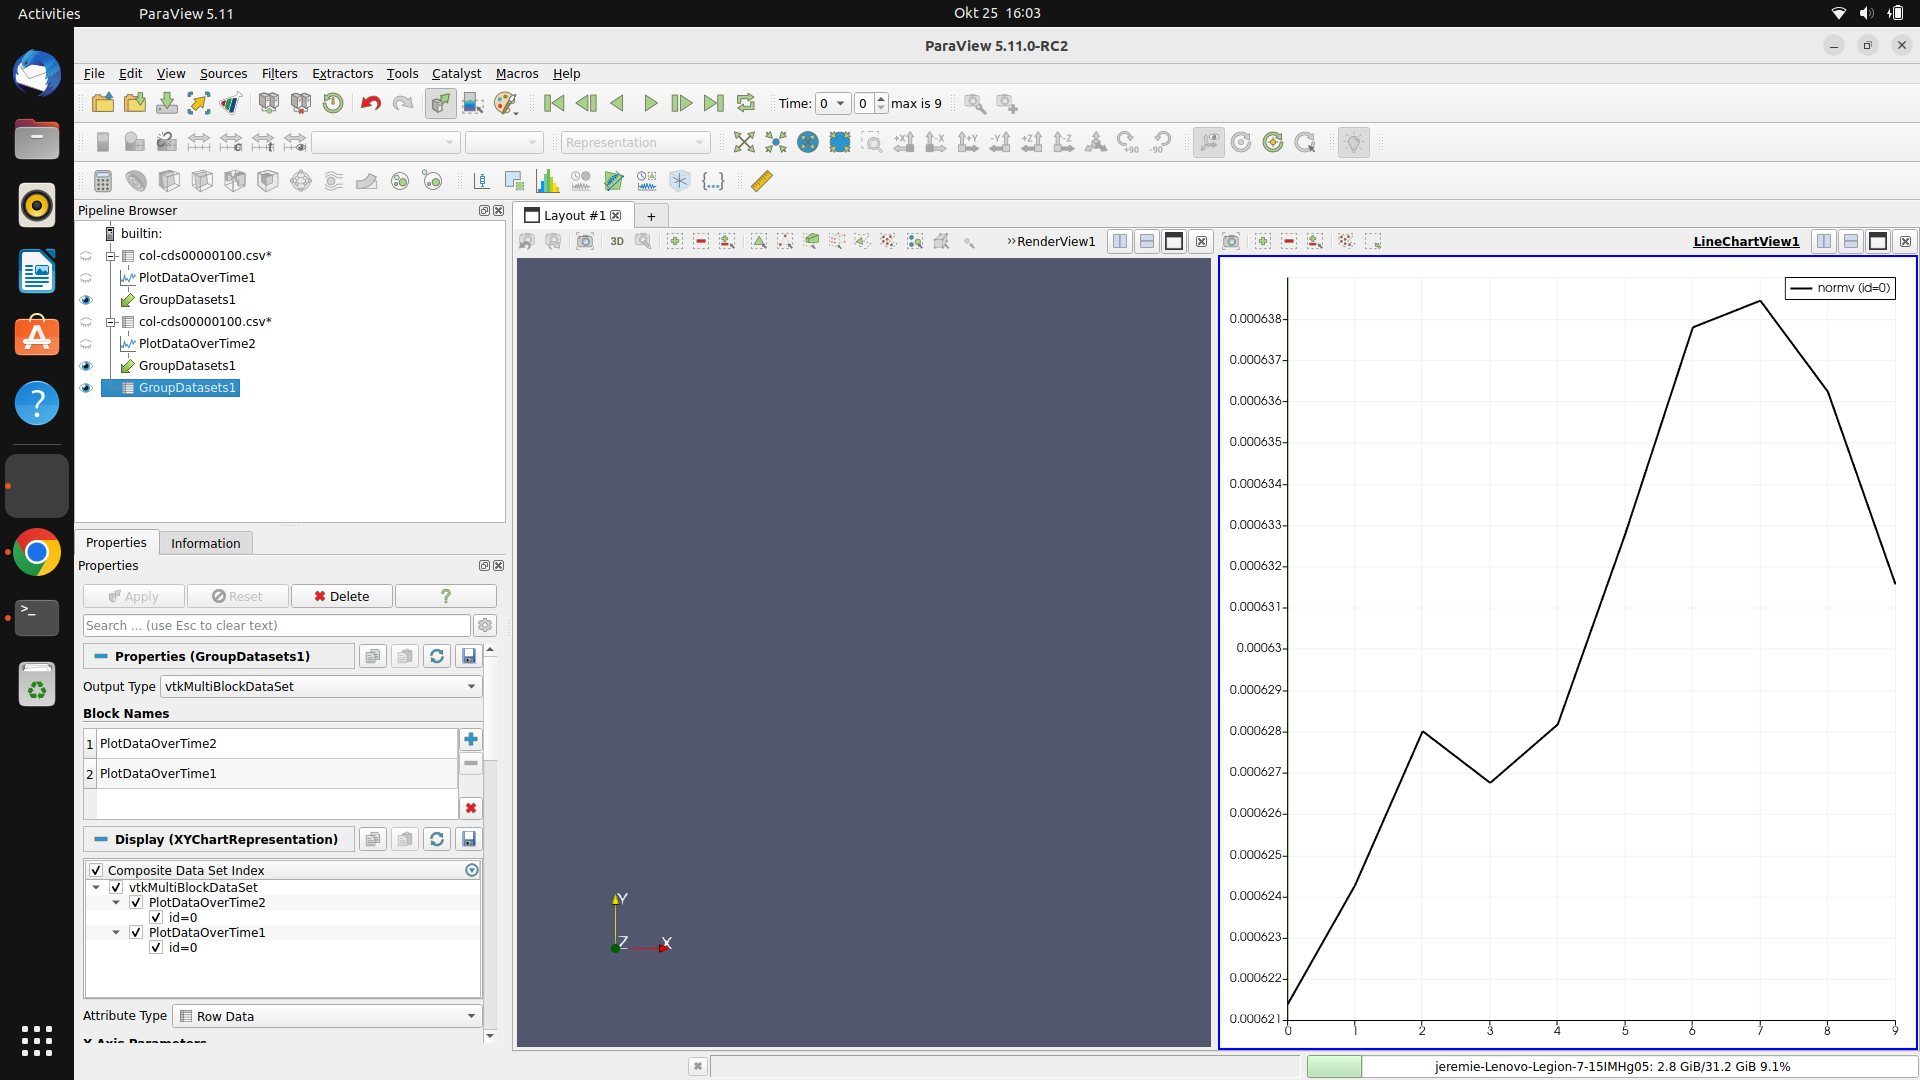
I am trying to do as you suggest.
I import my two series of files (still the same) and create the PlotDataOverTime datasets using Plot Data Over Time.
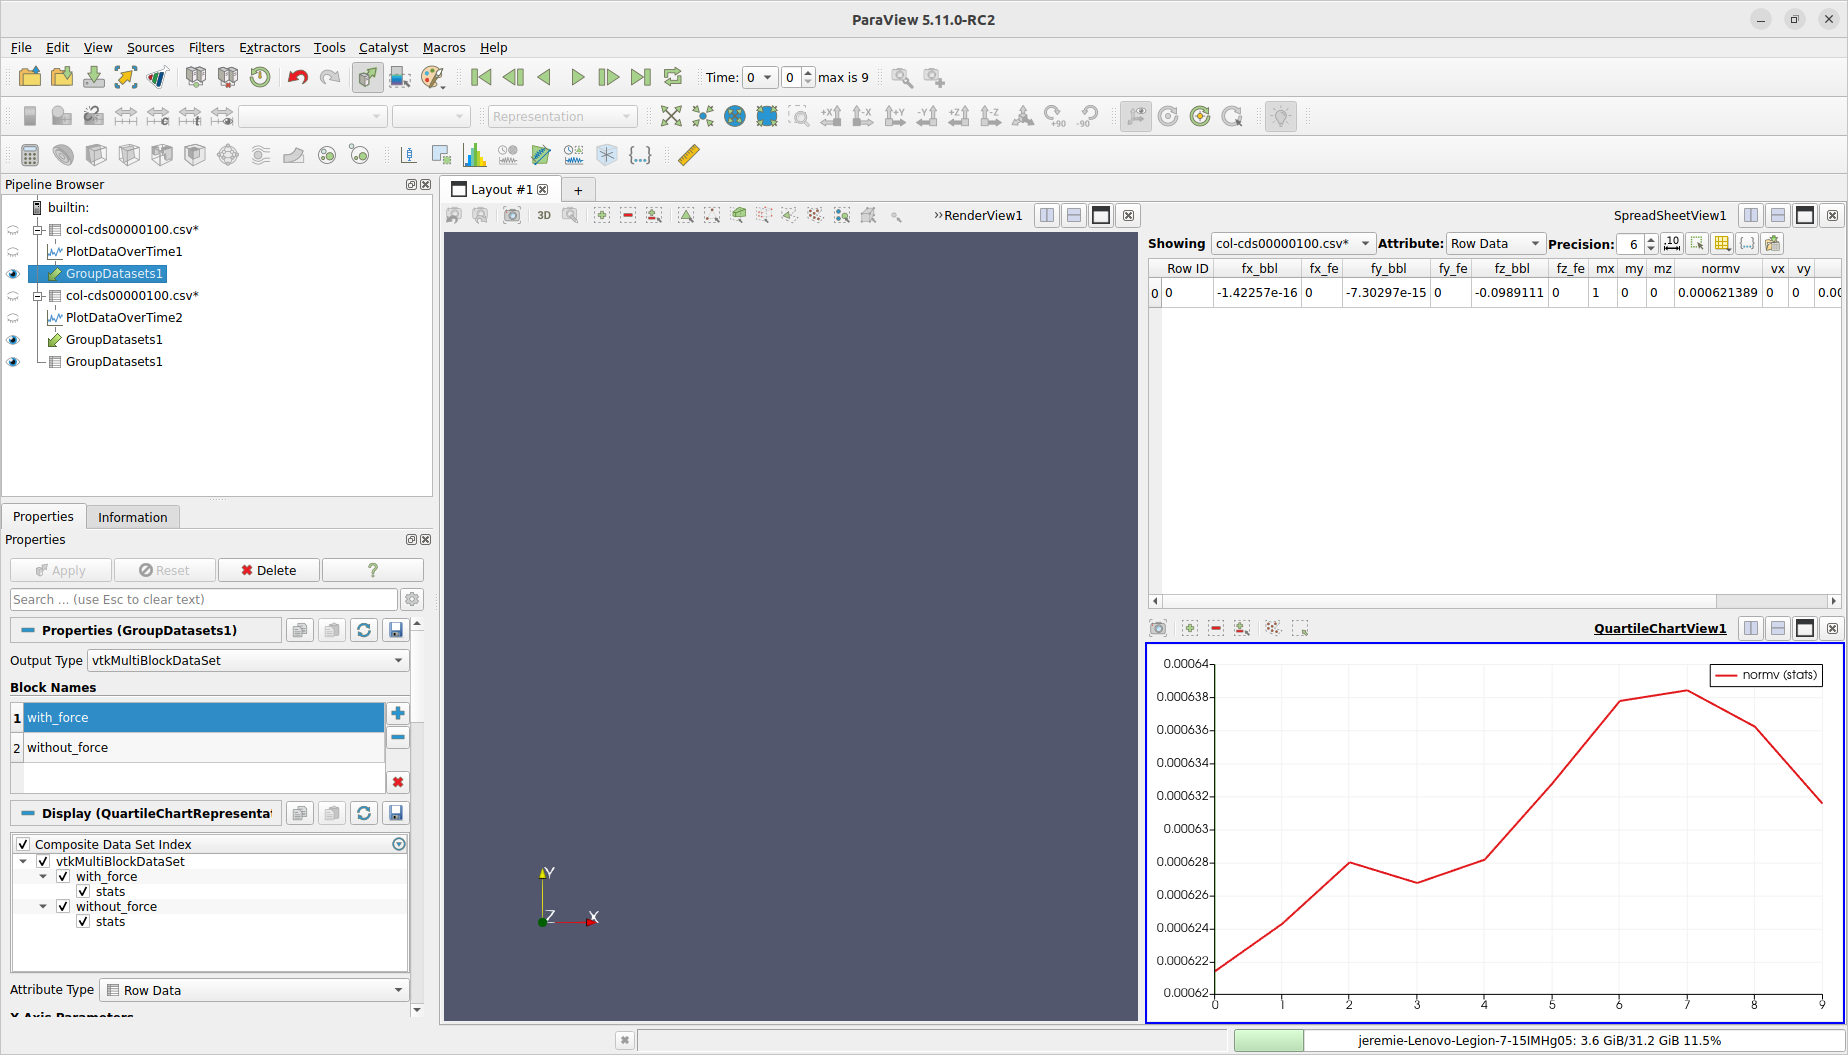
Then I group the two PlotDataOverTime datasets into one group using Group Datasets.
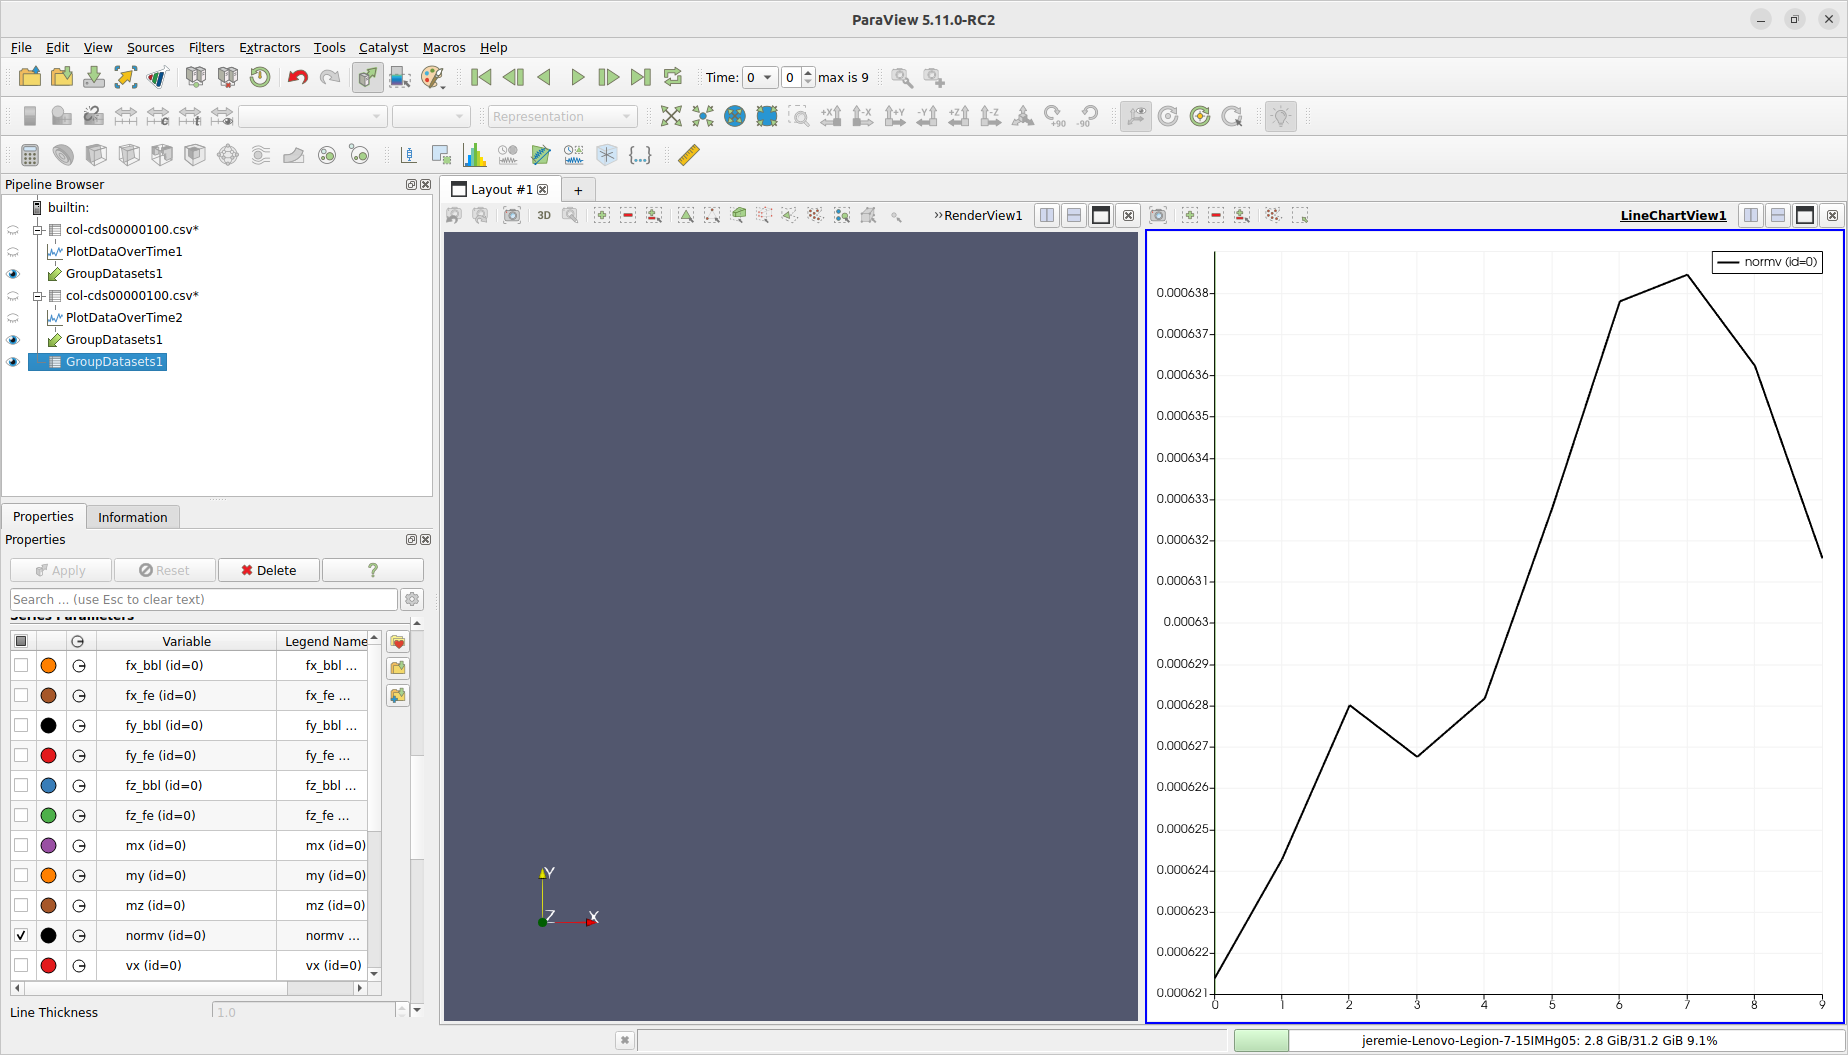
From there, I don’t see how to plot both lines on the same chart. As you can see above, I selected both PlotDataOverTime1 and PlotDataOverTime2 but only one appears on the line chart.
The problem of the names appearing in the legend remains unsolved too. Because if I change the names of the blocks that does not change the names in the legend.
If you have a solution, I would appreciate if you could explain step by step how you do it.
Best,
Jérémie
Well, GoupDataSets lets you rename the blocks, did you try it in your last example ?
Yes, I have tried and it does not change anything. If the block names mattered, the legend would indicate “PlotOverTime1” and “PlotOverTime2” instead of “normv (id=0)” or “normv (stats)” in the first place.
Plus, grouping after Plotting over time doesn’t seem to allow the two graphs to be shown on the same line chart
You are right, there is no way to do that (apart using some python programmable filter to handle the block renamming. I think there is an issues to fix:
https://gitlab.kitware.com/paraview/paraview/-/issues/21626