I am trying to use “Descriptive statistics” as an entry to calculator :
I want to calculate the mean+2sigma for each time step, but it seems not possible to use “mean” and “standard deviation” variables at the same time in the calculator. No output array is created in this case.
Is this because these two variables are on separated lines in the table output of “descriptive statistics ?”
You are correct; the two values are in different tables; the calculator expects the input columns to be in the same table. The spreadsheet view appends the table rows to one another for viewing but they are not really part of the same data.
Unfortunately this means you need to fetch the mean and standard deviation values from their respective tables. A simple python filter could do this. But if you are going to write a python filter, you might as well have it output exactly what you want (mean + 2*sigma).
The python calculator filter provides similar functionality to DescriptiveStatistics; you might look into using it to compute the mean and standard deviations instead of the DescriptiveStatistics filter.
Does anyone know why the statistics filter is designed this way? This definitely seems like an anti-feature. I cannot think of a good use case for splitting the output into two tables. And even if one existed, it would be a lot easier to use the Pass Arrays filter to subselect columns than to combine the tables together.
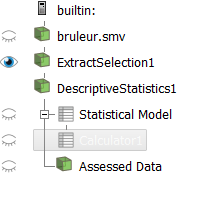
Here is a more helpful replay than my last one. Rather than make a Programmable Filter to compute (mean + 2*sigma) as @dcthomp suggested, it might be easer (or at least more generally applicable) to use a Programmable Filter to merge the tables together. You can do that by adding the Programmable Filter to the statical model of the statistics output, set the Output Data Set Type to vtkTable, and set the script to
inblocks = inputs[0]

for block in inblocks:
  for cIndex in range(block.GetNumberOfColumns()):
    output.AddColumn(block.GetColumn(cIndex))
This filter will merge the columns of the two blocks in the table. You can then apply the Calculator to the output of that to compute your expression.
Then in ParaView go to Tools → Manage Custom Filters.... Click on Import and then select this file. After you do that, you will have a new filter in ParaView named Merge Table Blocks that will do the table merging without you having to write the Python code each time.
@Kenneth_Moreland The VTK statistics filters were designed to model the process by which statistics are evaluated:
learning a minimal model from data,
deriving statistics from the model,
assessing data (either the data used during learning or other data),
and testing the model’s hypothesis.
The first table holds the minimal model (i.e., no redundant information – in this case the raw moments) while the second table holds statistics derived from the minimal model (mean, variance, skewness, kurtosis). The VTK filters can be configured to only perform subsets of the above and many meaningful pipelines may not wish to compute derived statistics. Some of the filters require significant computation to produce derived statistics (e.g., p-values).
While you can argue that these filters are an anti-pattern for ParaView, I think they simply expose an unfeature (or missing feature) of ParaView: that there is no way for filters to report small data back to the client for use by downstream filters. If filters could output something marked for ParaView as “named values,” then filters like the Calculator, the property-link system, Annotate Time, Annotate Selection, Annotate Global Fields, Mesh Quality, Integrate Attributes, and so forth would be much more useful because “named values” like the mean, variance, or integral quantities could be used to scale things, set thresholds, link to camera parameters, etc.
Many thanks for your answers, @Kenneth_Moreland, your custom filter do the job for the moment.
I will take some time later to script something more specific to my problem.
I understand the use case of turning on/off desired statistics to avoid unnecessary computation. But that seems completely independent of the issue of putting the results in separate blocks. There are lots of filters that allow you to turn on/off the computation of fields. For example, Gradient has lots of derived values that can be turned on/off. But it would be pointless to put the Q Criterion into a separate block than the Gradient.
Why wouldn’t the statistics filter work the same? Add or remove columns in the output table based on which are selected to be computed.
I agree that this a weak point of ParaView. That is all the more reason not to make the problem objectively worse by making the small data even harder to work with.