Using Point Data as Cell Centers in the Surface With Edges Visualisation

Dear community,

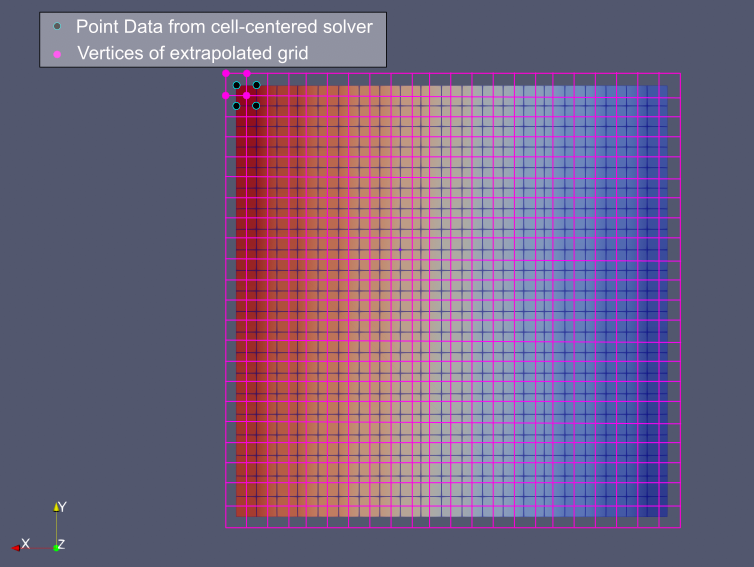
I would like to use ParaView to inspect the results I obtain from a cell-centered solver. The results obtained from the solver correspond to the midpoints of cubic volumes. However, ParaView interprets them as the vertex values of a structured grid. When choosing “Surface With Edges” as visualization this becomes obvious. In that case, I obtain a volume with 21 cubic cells in each direction instead of 22. I have visualized my problem in the enclosed figure. The dark points are the raw data that are interpreted as vertice values of a structured grid. The pink values would be the vertices of the larger grid, in which the raw data corresponds to the cell centers.

I am looking for a way to tell ParaView that the source data are the cell midpoints instead of the cell vertices. Is there any straightforward way to do this? I guess it requires extrapolation from the cell centers to the vertices and an averaging step at those.

Thank you very much!

For image data (Uniform Rectilinear Grid), it may be a good idea to save the data once to Xdmf Data File (File > Save Files… > Xdmf Data File (*.xmf)) and modify the origin position, Dimensions of Topology, and Center of Attribute in the xmf file as follows.

sample.zip (6.7 KB)

  • org.xmf
<?xml version="1.0" encoding="utf-8"?>
<Xdmf xmlns:xi="http://www.w3.org/2001/XInclude" Version="3.0">
  <Domain>
    <Grid Name="Grid">
      <Geometry Origin="" Type="ORIGIN_DXDYDZ">
        <DataItem DataType="Float" Dimensions="3" Format="XML" Precision="8">-10 -10 -10</DataItem>
        <DataItem DataType="Float" Dimensions="3" Format="XML" Precision="8">1 1 1</DataItem>
      </Geometry>
      <Topology Dimensions="21 21 21" Type="3DCoRectMesh"/>
      <Attribute Center="Node" ElementCell="" ElementDegree="0" ElementFamily="" ItemType="" Name="DistanceSquared" Type="None">
        <DataItem DataType="Float" Dimensions="21 21 21" Format="HDF" Precision="4">org.h5:Data0</DataItem>
      </Attribute>
    </Grid>
  </Domain>
</Xdmf>
  • cell_centerd.xmf
<?xml version="1.0" encoding="utf-8"?>
<Xdmf xmlns:xi="http://www.w3.org/2001/XInclude" Version="3.0">
  <Domain>
    <Grid Name="Grid">
      <Geometry Origin="" Type="ORIGIN_DXDYDZ">
        <DataItem DataType="Float" Dimensions="3" Format="XML" Precision="8">-10.5 -10.5 -10.5</DataItem>
        <DataItem DataType="Float" Dimensions="3" Format="XML" Precision="8">1 1 1</DataItem>
      </Geometry>
      <Topology Dimensions="22 22 22" Type="3DCoRectMesh"/>
      <Attribute Center="Cell" ElementCell="" ElementDegree="0" ElementFamily="" ItemType="" Name="DistanceSquared" Type="None">
        <DataItem DataType="Float" Dimensions="21 21 21" Format="HDF" Precision="4">org.h5:Data0</DataItem>
      </Attribute>
    </Grid>
  </Domain>
</Xdmf>

This modification would change the data as follows:

sample

Thank you @Kenichiro-Yoshimi for the fast and helpful reply!
I tried to follow your instructions but in my case, the .xmf file looks a little different in terms of Geometry, Topology. It already had the “Dimensions=22 22 22” in the Topology.

<?xml version="1.0" encoding="utf-8"?>
<Xdmf xmlns:xi="http://www.w3.org/2001/XInclude" Version="3.0">
  <Domain>
    <Grid Name="Grid">
      <Geometry Origin="" Type="XYZ">
        <DataItem DataType="Float" Dimensions="10648 3" Format="HDF" Precision="8">PhaseField_0.h5:Data2</DataItem>
      </Geometry>
      <Topology Dimensions="22 22 22" Type="3DSMesh"/>
      <Attribute Center="Node" ElementCell="" ElementDegree="0" ElementFamily="" ItemType="" Name="PhaseFields" Type="None">
        <DataItem DataType="Int" Dimensions="22 22 22" Format="HDF" Precision="4">PhaseField_0.h5:Data3</DataItem>
      </Attribute>
    </Grid>
  </Domain>
</Xdmf>

Should I replace the Geometry type and the Topology type of my data to match your version?

Since your data type is not Image but Structured (Curvilinear) Grid, you cannot directly apply the method I suggested. If the spacing of the grid is constant, you could just change it to Image (Uniform Rectilinear Grid) data type by using the Resample To Image filter and then modify the xmf file, but that seems tedious. I am not sure what format the solver currently uses, but I think it would be better to output the data directly as cell center data.