I’m trying to obtain a new array defined as absPres which can be defined as “p-hydroPres”. Here p is pressure (a scalar Point Data) and hydroPres is the p at y=max(y) over a line. I can’t figure out how to get hydroPres on a line and then absPres at each point using the calculator or Python calculator. Could anyone help me?
Think the Calculator as an operator that is repeated on each point. You do not have access to anything else than the current point attributes. So max(y) has no sense in this context, nor has p(y). So you have to write some python script.
Many thanks for your answer. I’m new to ParaView and have been trying to understand the Programmable Filter, but I still need help. Please let me explain what I have been trying.
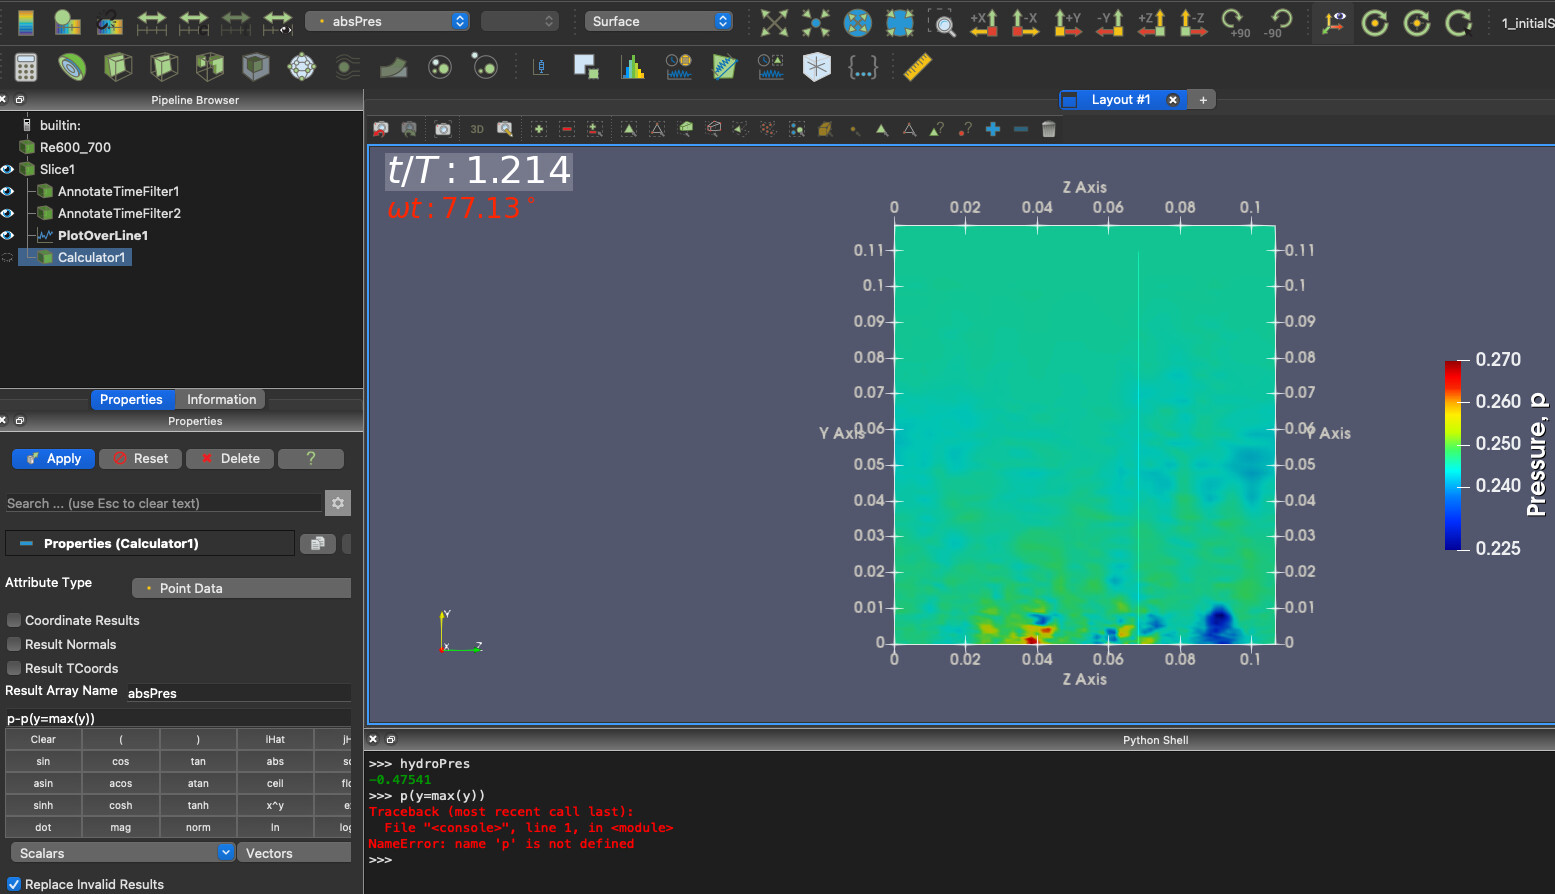
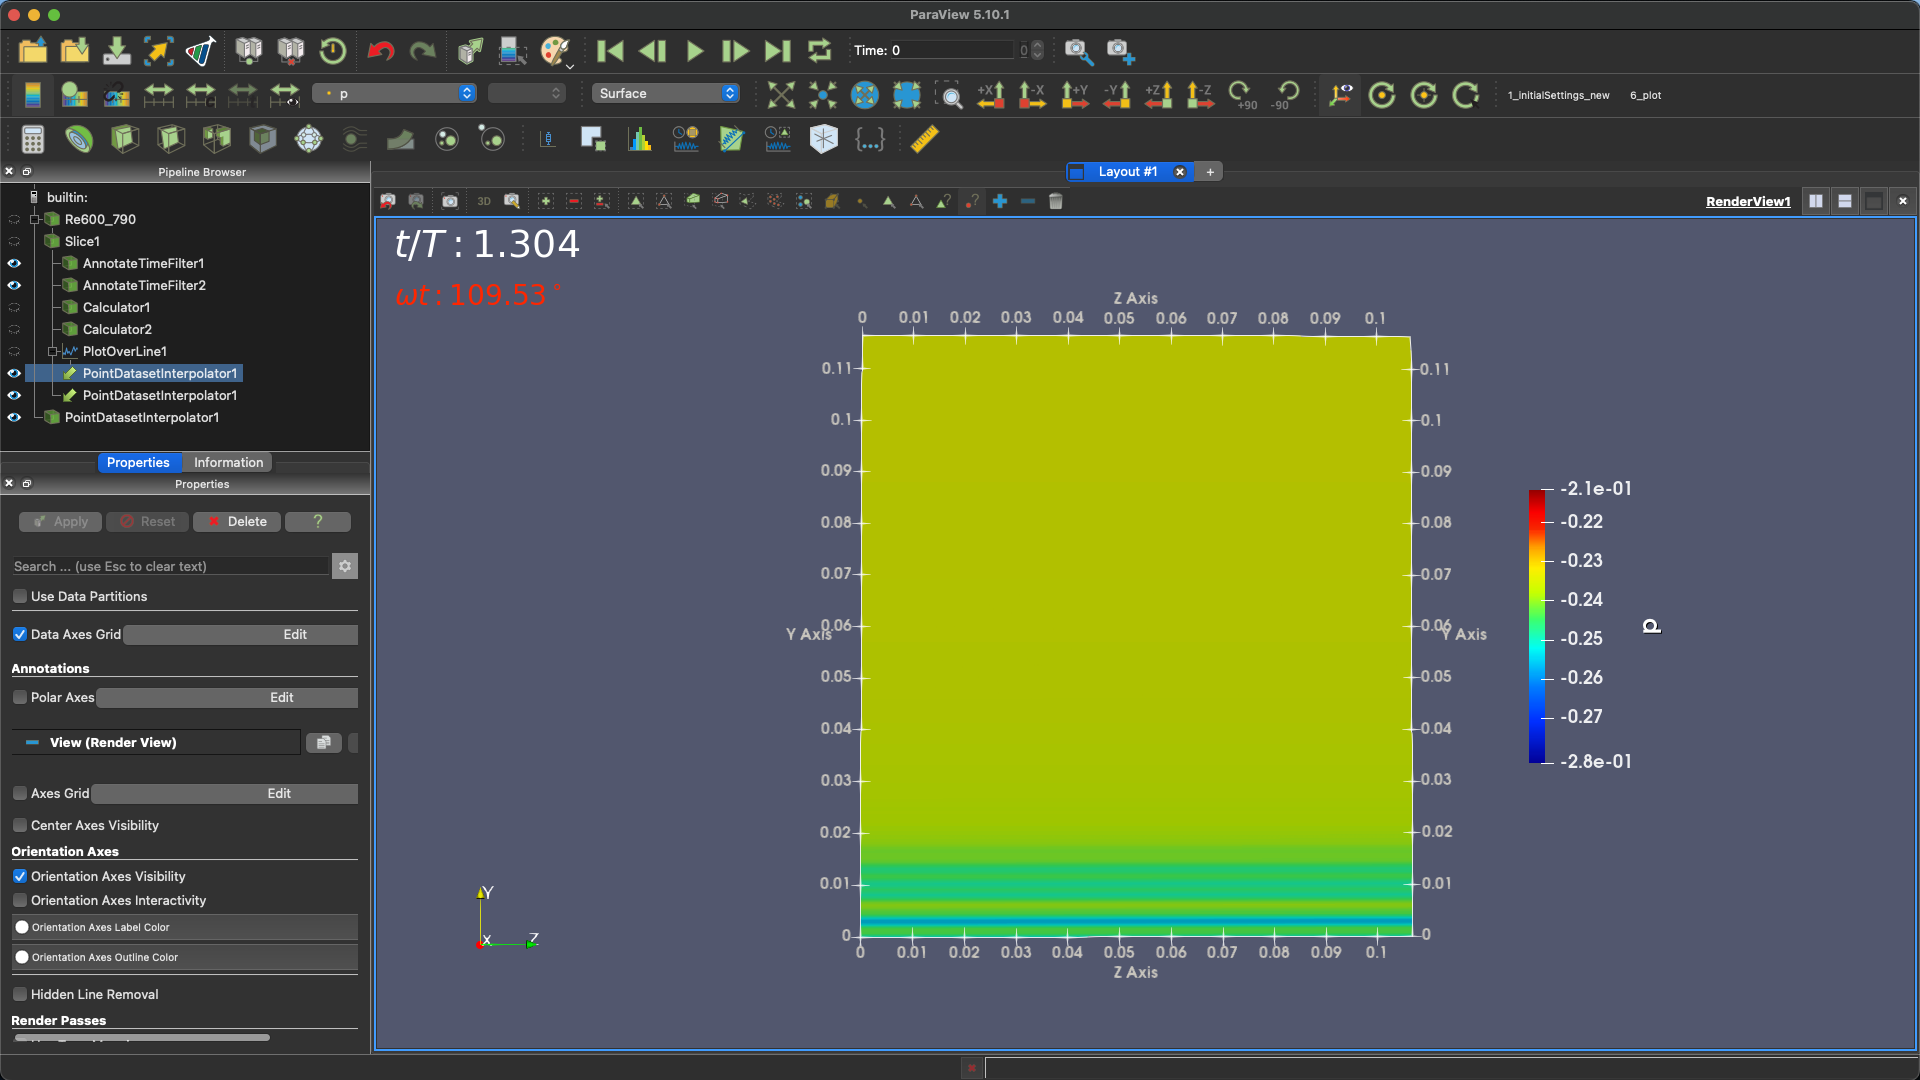
As can be seen in Figure, I have data “p”. I need to get a value, so-called hydroPres, at maximum y (e.g, here is y=0.115 and z=0.058) and then calculate “p-hydroPres” (let’s call it absPres) as a new variable. Final thing that I want to do is visualize this new variable (absPres) in ParaView.
There is another method that does not use the Programmable filter.
In that way, the use of nearest neighbor extrapolation, using the Voroni kernel of the Point Interpolation filter, extends the value at ymax to the entire region.
The steps are as follows:
Use the Plot Over Line filter to plot the data on a line parallel to the horizontal axis at ymax.
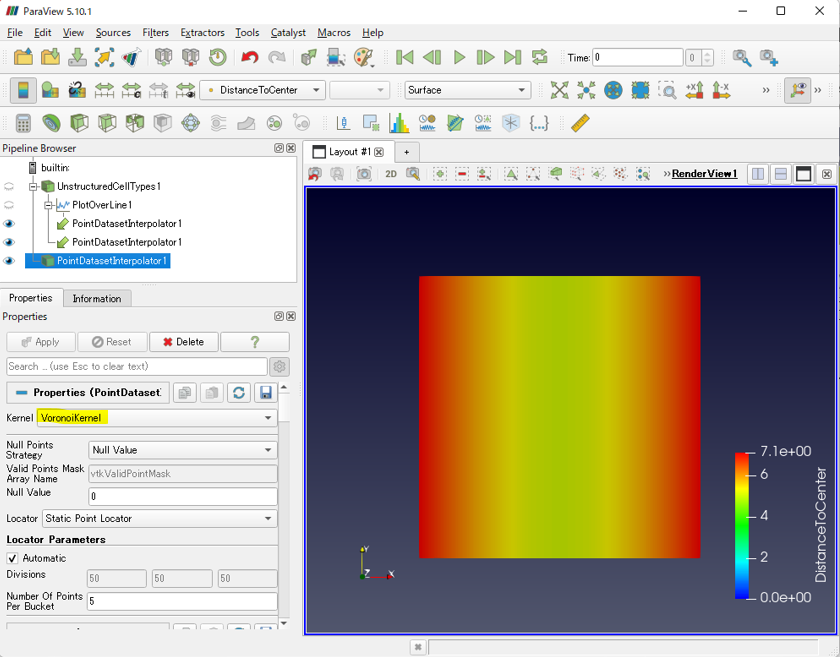
Using the Voronoi Kernel of the Point Dataset Interpolator filter, the ymax data is extrapolated to the nearest neighbor over the region. Here, specify the following:
Select both Slice1 and PointDataSetInterPolator1 on the Pipepline Browser while holding down the Ctrl key, and merge the data with the Append Attributes filter.
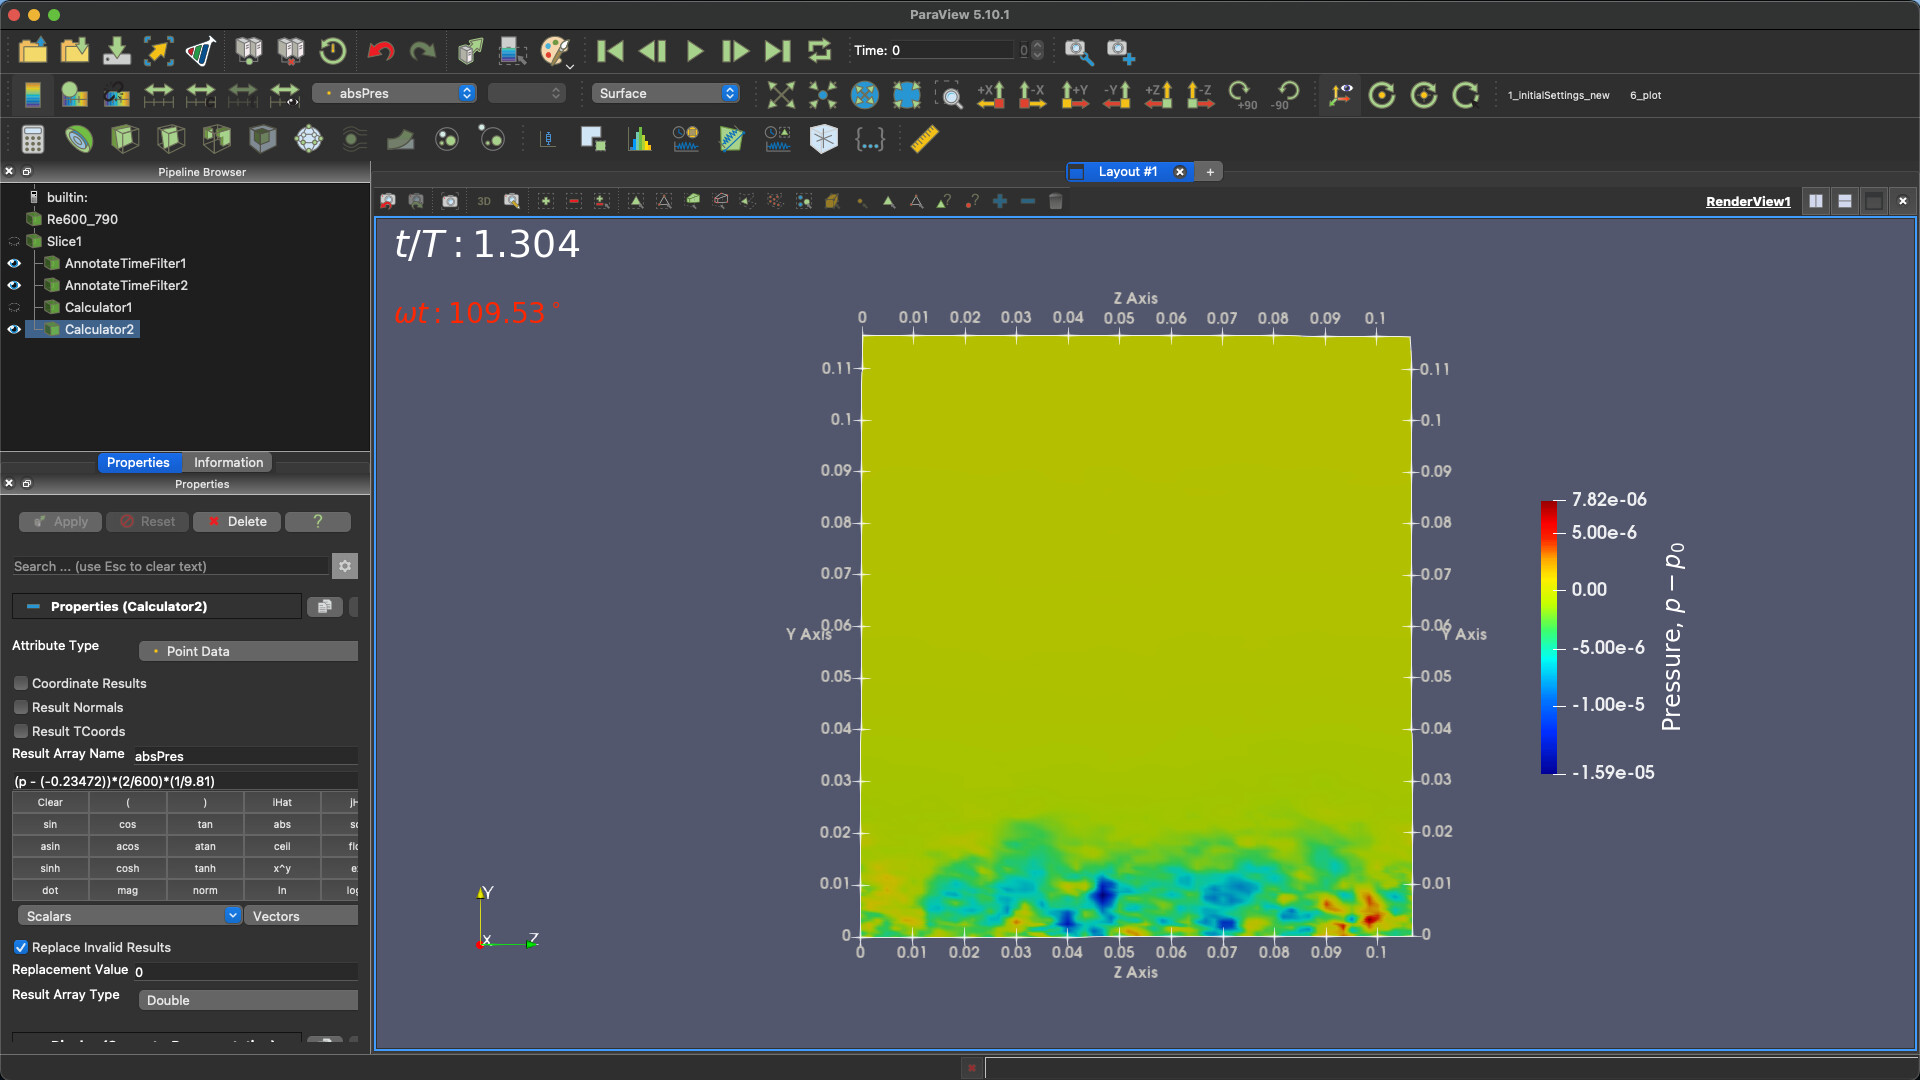
Finally, the p - hydroPres could be calculated using the Calculator filter.
Apologies for the late reply; I’ve been busy building ParaView on my personal computer.
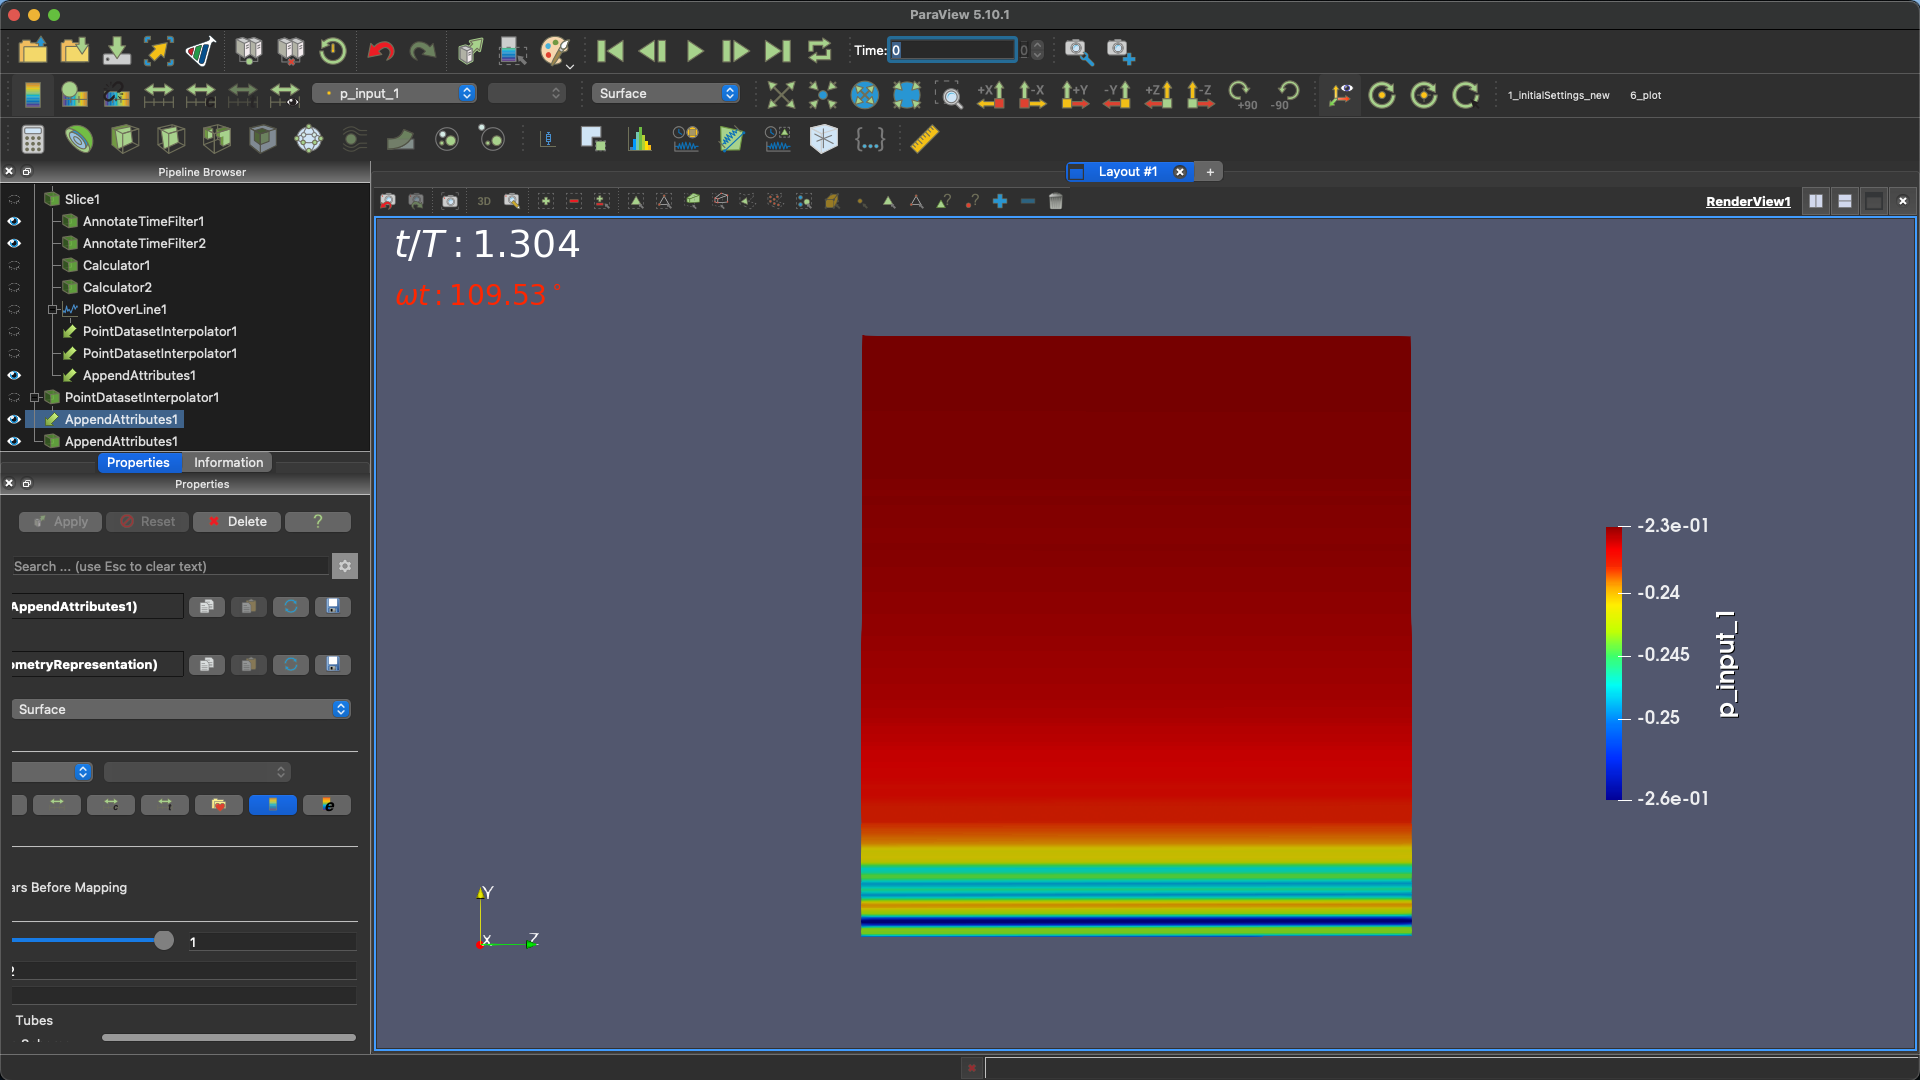
Thank you for your answer. I think this is the solution in my case. However, some things are still unclear to me. For example, there are some new data named “p_input_1”, “u_input_1”, etc. Here, the value of p_input_1 at maximum y is what I’m looking for, isn’t it?
Let me share the outputs I obtained with respect to the steps you suggested
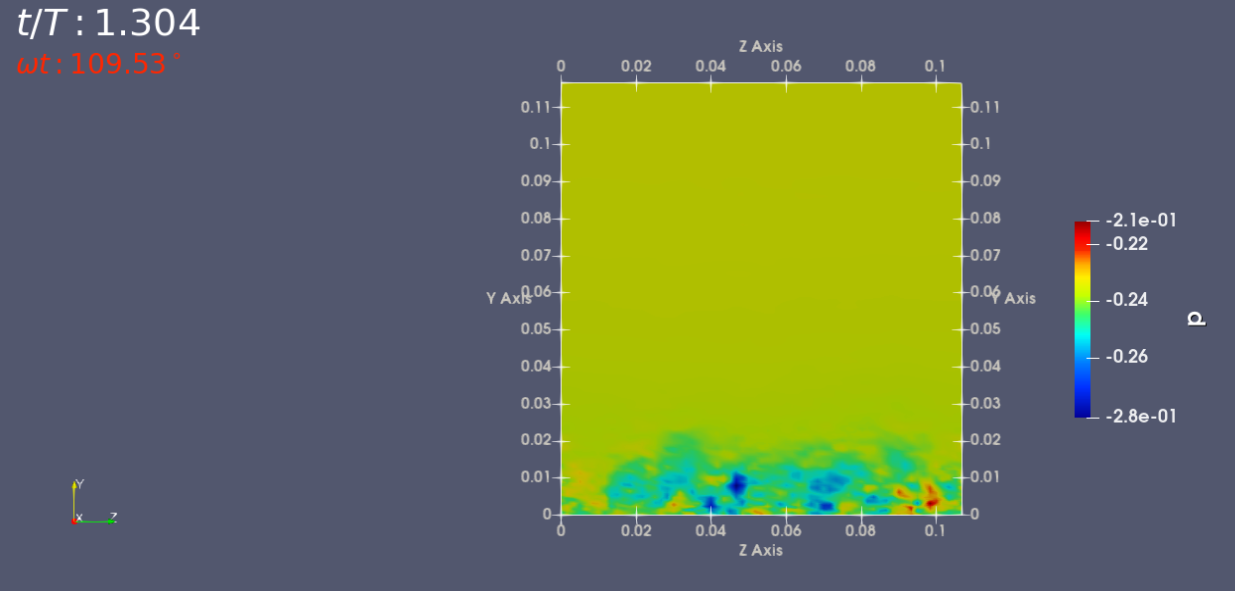
This figure shows what the final result should be: