I am using “Plot Over Line” filter for the values from “Calculator” filter.
And after saving the values to CSV, I just double-checked the values and found the value deviates.
I want to provide the original VTK file that I used, but it is over 4MB so I cannot upload it here. Instead, I uploaded the Saved CSV data.
Basically what I want to calculate is
((ne20_m-3+beta_imp*nimp_1d20)*Te_keV + (ne20_m-3-0.9*nimp_1d20)*Ti_keV)*0.5
This is exactly the expression I copy and pasted from my paraview calculator.
On the paraview GUI, it gives a plot like follows (I plotted Points_X being the x-axis)
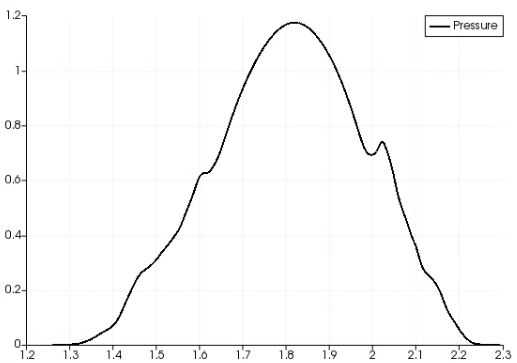
However, if I do the same thing but with python and CSV file, it gives somewhat different shape.
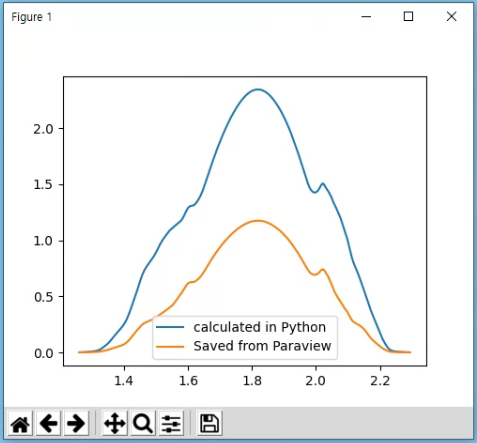
Of course the profile shown in the paraview GUI is well saved in the CSV (“Pressure”), but I really do not see the reason why the values from python is very different from that one…
This is the Python script I used.
import pandas as pd
import numpy as np
import matplotlib.pyplot as plt

def main():
    #filename = "plot_over_line_2600_n0.csv"
    filename = "plot_over_line_saved.csv"
    data = pd.read_csv(filename)

    # Te_keV
    # Ti_keV
    # beta_imp
    # j_MA/m2
    # j_ps2_MA/m2
    # ne20_m-3
    # nimp_1d20
    # Points:0

    '''
    npt = np.shape(data["Points:0"])[0]

    Ptot = np.zeros(npt)
    for i in range(npt):
        Ptot[i] =   (data["ne20_m-3"][i]+data["beta_imp"][i]*data["nimp_1d20"][i])*data["Te_keV"][i] \
                  + (data["ne20_m-3"][i]-               0.9 *data["nimp_1d20"][i])*data["Ti_keV"][i]
    '''

    fig, ax = plt.subplots(1,1,figsize=(5,4))
    #ax.plot(data["Points:0"], data["j_MA/m2"]     - data["j_MA/m2_input_1"]    , c='k', label=r'$\delta j$')
    #ax.plot(data["Points:0"], data["j_ps2_MA/m2"] - data["j_ps2_MA/m2_input_1"], c='tab:orange', label=r'$\delta j_{PS}$')
    ax.plot(data["Points:0"], (  (data["ne20_m-3"] + data["beta_imp"]*data["nimp_1d20"])*data["Te_keV"] \
                               + (data["ne20_m-3"] -             0.9 *data["nimp_1d20"])*data["Ti_keV"] )*0.5, c='tab:blue', label='calculated in Python')
    ax.plot(data["Points:0"], data["Pressure"], c='tab:orange', label='Saved from Paraview')

    ax.legend()

    plt.show()

if __name__=="__main__":
    main()
Why this happens?? (I am with version 5.6.2)
It is very likely that I made a very stupid, basic mistake in typing the formula, but I checked over an over and over again and was not identify the cause. At least I am very sure that the expression I shown at the top of this post is the one I used in the paraview calculator filter (believe me)
plot_over_line_saved.csv (325.1 KB)