I have tecfiles that are numbered 1.tec, 2.tec, 3.tec, and so on. A file named n.tec represents the deformed state of a sphere at the nth second as the sphere is moving. How can I see all the deformed states together? When I open the files in Paraview, they appear in pipeline browser clubbed together. I can see the animation of the deformation of the sphere, but I want to see all states together in one image, showing the trajectory and deformation of the sphere and apply a same filter to all the files. I have attached screenshot of pipeline browser. The “centerline*” has 1000 files .tec files clubbed together. Currently, the three glyph filters in the pipeline browser are applied to each .tec file, which is what I want. However, I also want to view all the files at once in a single image, but I do not know how to do this.
You can expand the group in the file chooser dialog and select each file individually. This will read them in as individual files.
Hello Cory,
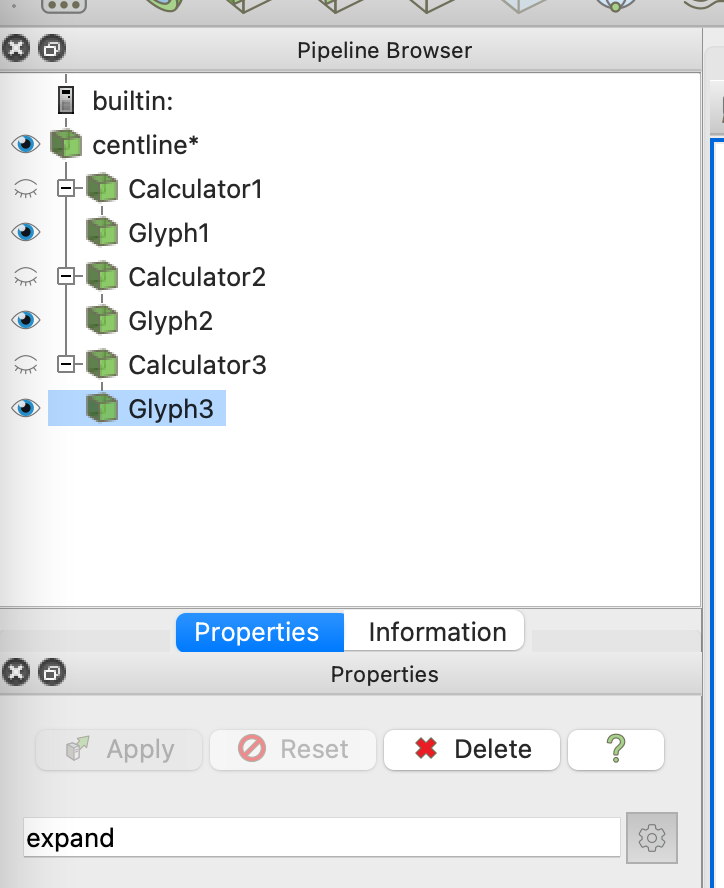
Thank you for your response and patience. I am not sure how to expand the clubbed files individually. I’ve attached a screenshot of my pipeline browser and made a small edit to the question. In the pipeline browser, the “centerline*” section contains 1000 .tec files clubbed together. Currently, the three glyph filters in the pipeline browser are applied to each .tec file, which is what I want. However, I also want to view all the files at once in a single image, but I do not know how to do this.
@Arun_Kumar to open the files individually, see 2. Loading Data — ParaView Documentation 5.12.0 documentation, especially Figure 2.2, to see how to open files individually instead of grouping them.
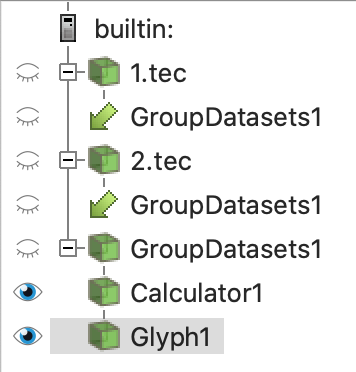
I think I understand that you want to load each deformed sphere from each .tec file and show it along with all the others after applying glyph filters. Loading each file as described in the ParaView User’s Guide and applying filters like you have to each of them will certainly work, but it will require a lot of work to set up in the Pipeline browser, and having that many sources in ParaView may cause significant performance slowdowns. To help with that, you could group the datasets together by selecting all of them in the Pipeline browser and applying the Group Datasets filter. From that filter you can add your 3 Calculator and 3 Glyph filters and then you are done.
The Pipeline would look something like