Hi everybody,
I currently try to represent some data with geographic coordinates (RGF93, so big number in X and Y).
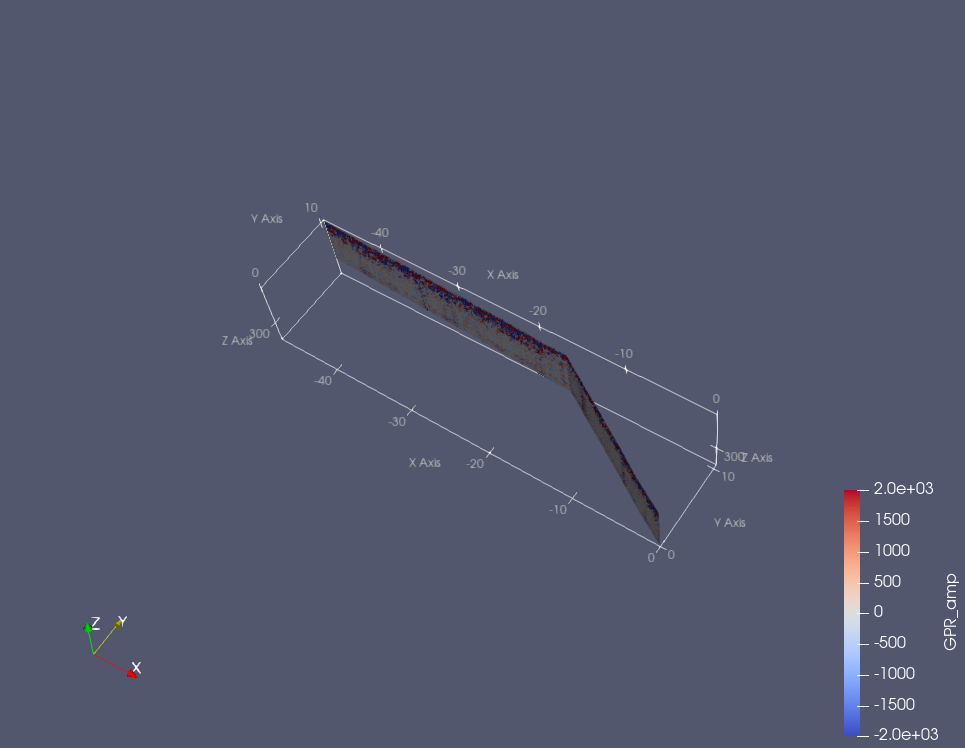
When I plot vtk file, the representation is not good (there is some steps) :
Thank for your response !
I have already tried to transform file 2 (local coordinate) to file 1 (global coordinate) with transform filter and I still have the same problem. I think there is a problem with when working with geographic coordinates. For the moment I therefore work in local coordinates but I would like to be able to work globally.
This does not look like a problem with “large” coordinates. The values of the coordinates are on the order of 6 \times 10^6, which is no problem for the 32-bit floats used by ParaView’s rendering or any of the other operations.
That could be. ParaView does not treat geographic coordinates specially. It treats all coordinates as Euclidean. I’ve used this to represent latitude/longitude and do some simple calculation to project that to a sphere or other projections, and that works just fine.
I don’t know if RGF93 coordinates cause a problem. I’ve never heard of them before this post. But there might be a discontinuous relationship between what you call “local coordinates” and RGF93. You didn’t specify, but are your “local coordinates,” but it seems likely that they would be in New Triangulation of France (NTF) coordinates. That might explain what is going on here.
To repeat myself, I never heard of RGF93 nor NTF before this morning, and I’m going to base the next thing I say completely on the French to English translation of a short Wikipedia article, so take what I say next with a lot of skepticism. I may be wrong.
But, I note that to convert from NTF to RGF93, you use an established triangulation of France. As you plot points that pass over triangulation regions, you could get bends in the data as you cross from one cell to the next.
That said, a true conversion between NTF and RGF93 I think uses a 4th or 5th interpolation within the grid. I assume the 5th order grid would maintain C1 continuity, which should prevent the stair artifacts. You didn’t say what you are using to make this conversion (or even if I’m right about the NTF coordinates). Maybe the conversion is being lazy and just doing a 1st order approximation, which could definitely result in artifacts.
In all, you might need to talk to a French cartographer, who would definitely understand this better than I.
Thank you very much Kenneth for taking time !
I don’t think it comes from the coordinate transformation because I already have the correct coordinates before exporting data. I use matlab to create my vtk files. The example in local coordination (2nd figure) is a simple translation by taking an Xrgf and Yrgf before the matlab export.
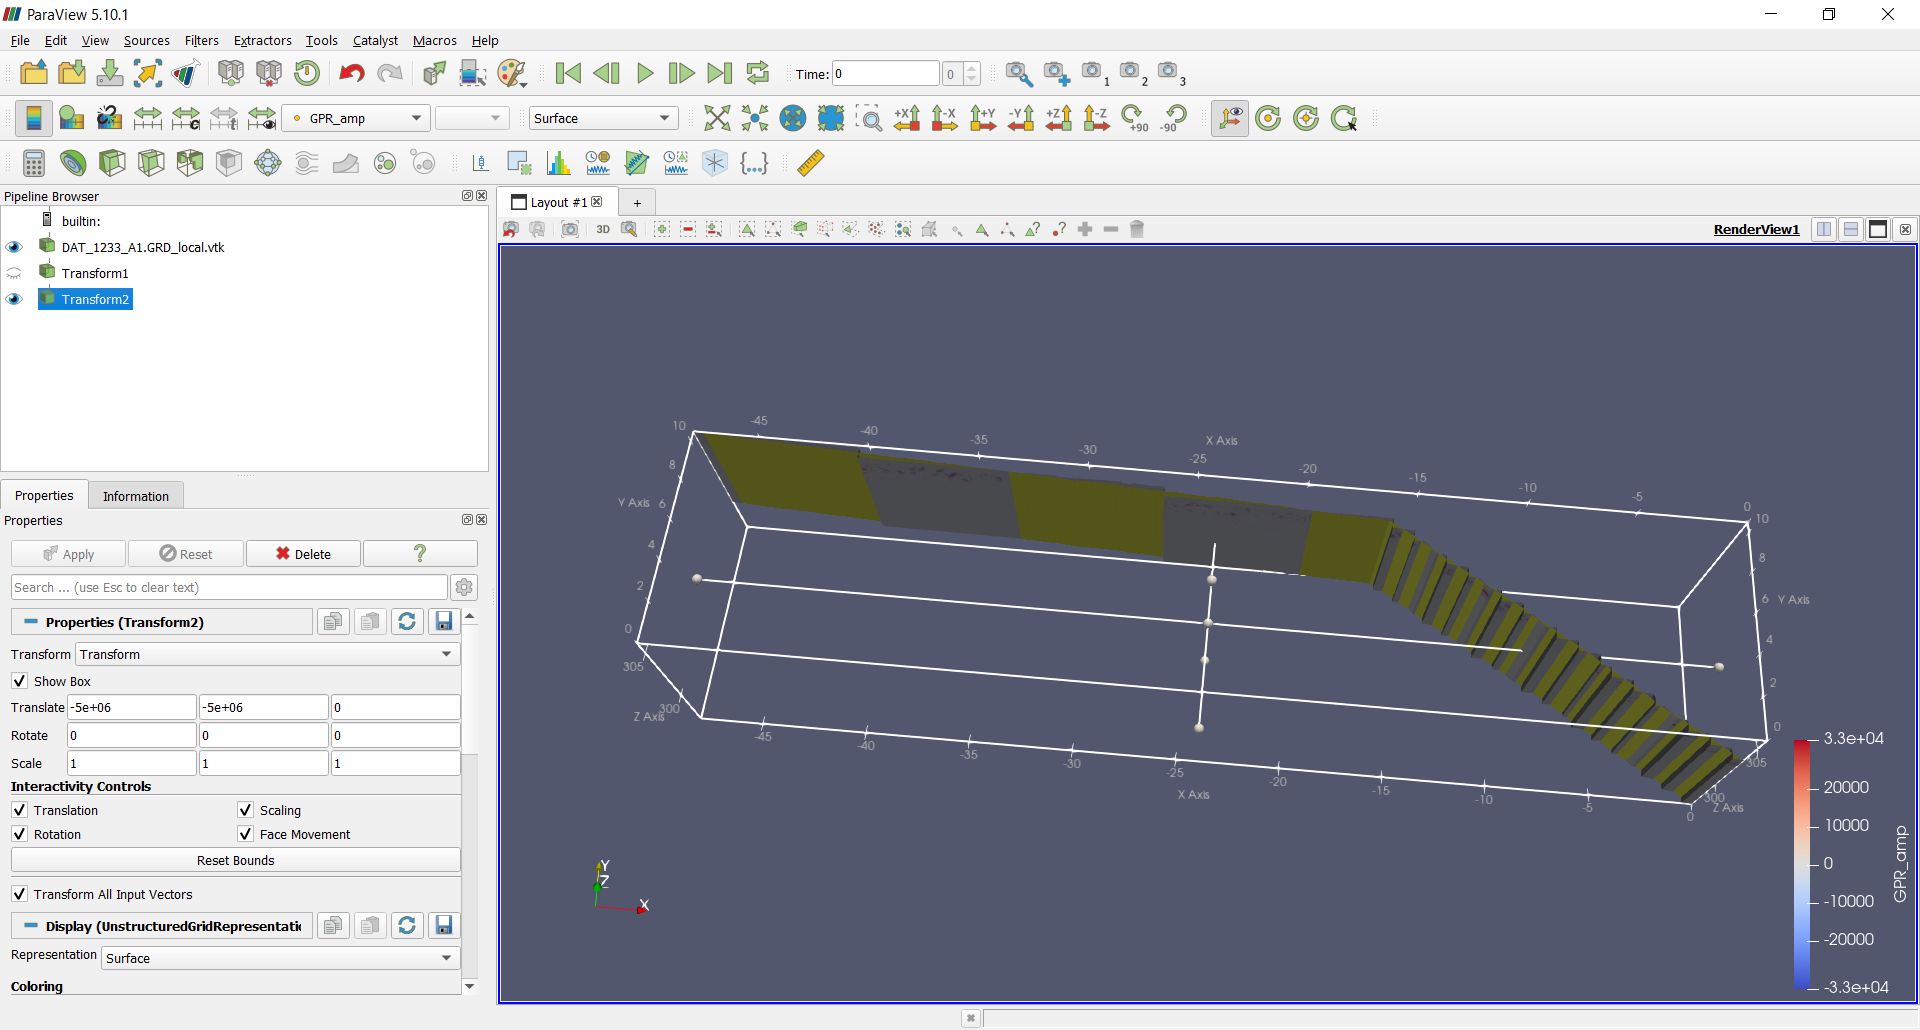
I had fun doing the following manipulation. I starting from example 2 (local coordinate, yellow plane in the new figure). I added using the Transform tool in paraview respectively 5e+06 and 5e+06 for X and Y coordinat. After I removed with the same filter -5e+06 and -5e+06 for X and Y coordinate. The new files present same problems (see figures)
I don’t really understand what you are saying. It would probably help if you would post your data and give the details of the transforms you are doing.
You will find the dataset in this post.
I used this data. Firstly, I use the transform filter (Translate X by 5+06 and Y by 5+06). Secondly I use a second transform filter (Translate X by -5+06 and Y by -5+06). I get the previous figure
OK. That’s a little weird. It looks like @Christos_Tsolakis was on the right track about rounding issues. It looks like in your file the point coordinates are represented as 32-bit floating point numbers. I would think you would be able to do a translation by 5 million and still represent the data, but for some reason the calculation is dropping some of the least significant bytes.
The problem seems to solve itself if you load the point coordinates as 64-bit floating point instead of 32-bit floating point. (VTK seems to preserve the data type.) Probably the easiest way to do that is to change your data file to load as float instead of double. If you load your file in a text editor, you will see the first few lines look like this:
The line POINTS 379620 float signals the start of the point coordinates, and tells VTK to read it into a float-32 array. To load the data as 64-bit floats, simply change float to double.
If changing the input file is not really an option, it is possible to change the point coordinates to doubles using the Calculator filter. The Calculator filter always creates double arrays, so just set the expression to coords and turn on the Coordinate Results option.
Yes, it is weird but I make that in order to see the origin of the problem !
Great is working now !!! I had try with the original dataset (with RGF coordinate) and the representation is good ! I will change my matlab script in order to have proper vtk dataset.
Thank you very much Kenneth