I have two volumetric meshes in .vtk format (i.e. ground-truth and predicted versions) and I want to visualise the relative error (or error ratio per vertex) by thresholding on deformations for example deformation less than 1 mm just make it green, deforamtion within1mm to 5 mm to yellow and deforamtion > 5 mm in red. Is it possible in Paraview ? If so can you elaborate the steps with an example please ?
I have herewith attached two samples .vtk files for your further reference. sample_data.zip (80.7 KB)
If there is no change in the corresponding nodal IDs between the two meshes, then there is one solution.
Create variables for the coordinates in both mesh_5_groundtruth.vtk and mesh_5_prediction.vtk with the Calculator filter, respectively.
Result Array Name: coords
Expression: coords
Select the two calculators created in step 1, Calculator1 and Calculator2, while holding down the Ctrl key in the Pipeline Browser, and combine the above two coords variables into one mesh using the Append Attributes filter.
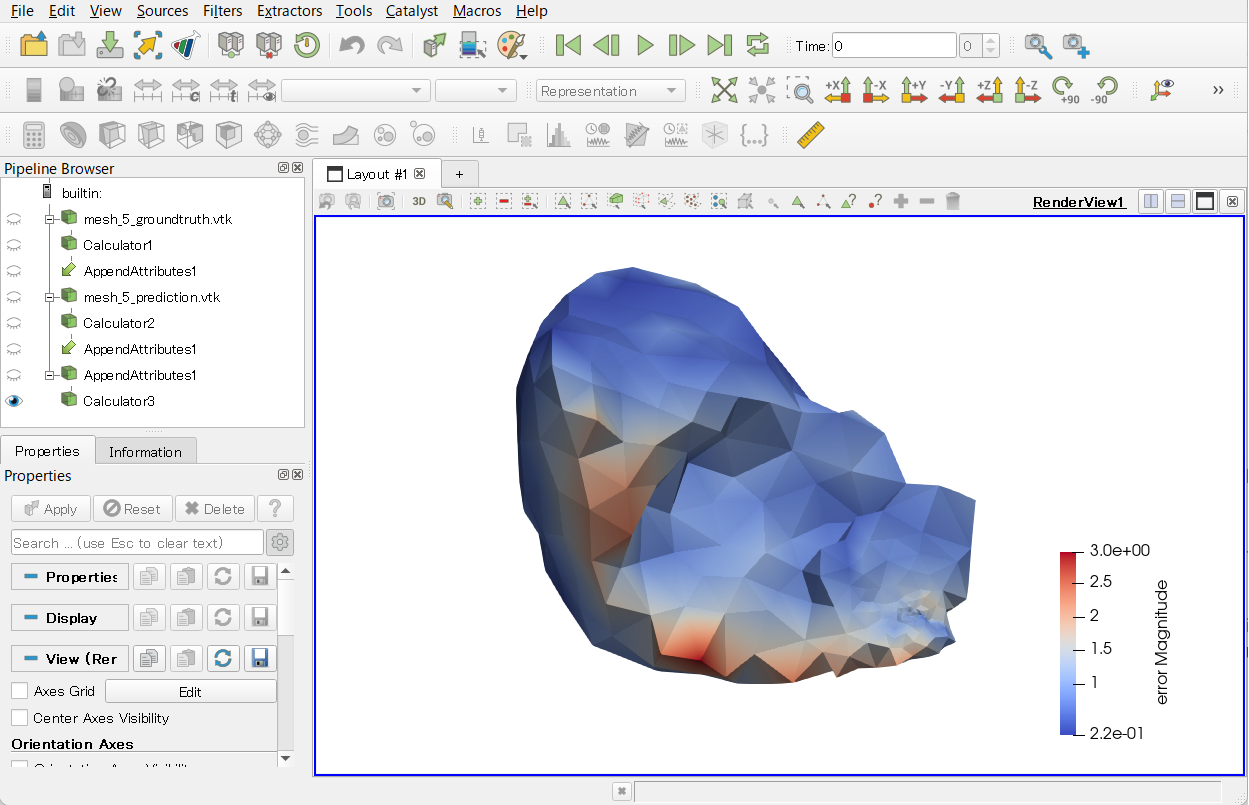
Apply the Calculator filter to AppendAttributes1 and calculate the relative error.
Result Array Name: error
Expression: mag(coords_input_1-coords)
The following is the State file for the above procedure. error.pvsm (741.2 KB)