Would someone be able to recommend a way to display 2D greyscale images with 3D coordinates in Paraview? I have a series of 2D slice planes in 3D space (such that I know the 3D coordinates of each pixel as well as the greyscale intensities at each location).
I have tried writing these images as .vtk files (structured XYZ grid with scalar/greyscale values), but can’t find a suitable representation. Both ‘surface’ and ‘points’ representations appear as discrete points in space (perhaps unsurprisingly), rather than a flat interpolated image with no ‘gaps’ in between the pixels. Are there any filters that are able to convert these points into a plane object?
Alternatively, I am aware that .vti and .vtp file formats may work for this purpose, but unfortunately I am not familiar with any means to generate these data.
Any help would be appreciated!
Hi,
If you are able to load these points into Paraview, then apply the Delaunay2D filter that creates an actual surface mesh from the points. Important: the points must lie in the XY plane
An alternative is to use a Plane source and then use ResampleWIthDataSet to put the point data in the plane mesh.
Best regards,
Miguel
Hi Miguel,
Thanks for your suggestions.
Unfortunately the Delaunay2D filter method didn’t work for me as many of my images lie perpendicular to the XY plane for the most part and produced images with a striped appearance. (For the ones which were oriented mostly in the XY plane, this did work, but proved to render significantly slower than the original points.)
Could you please provide more detail by what is meant by using a Plane source? I hope to try this out.
Kind regards,
Debbie
Hi,
Yes, I agree with the loss of quality. I had also the same issue.
The Plane Source alternative I think could be better. Just go to:
Sources --> Plane
This tool allows you to create a structured plane mesh with quads (You can also use “Structured Grid” source in newer versions of Paraview). Just create a plane with the desired dimensions and orientation, with the same points in each direction than your images.
Then load you image and finally you can interpolate the data arrays of your image into the plane grid points. In order to do that go to:
Filters --> Alphabeticals --> ResampleWithDataSet
This filter requires 2 data sets: the “input” and the “source”. In your case the input is the image and the source is the Plane.
This should do the trick. If this do not work, maybe you can share some of your images to have a better idea of your problem.
Good luck
Miguel
Hi Miguel,
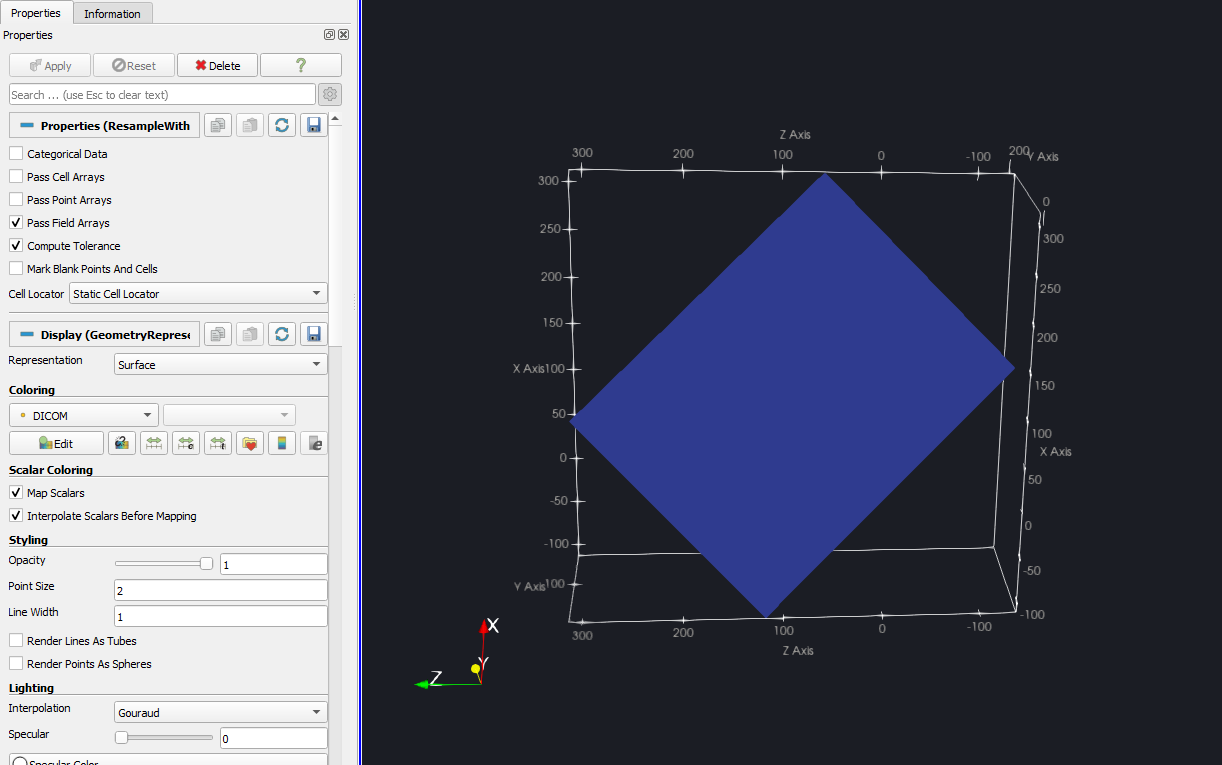
Thanks for the further explanations. I created a plane source with the exact same dimensions and orientation as my image, and selected the ResampleWithDataset filter. Using Paraview 5.8.0, I selected the image (a .vtk file with grayscale intensity values labelled “DICOM”) as the input for “Source Data Arrays”, and the plane as the “Destination Mesh”. However, this results in a blank plane. Are there any properties I need to adjust?
I have attached a sample image here. The plane source inputs should be:
Origin: 125.000, 98.977, -137.798
Point1: -112.868, 17.774, 117.963
Point2: 312.255, 168.156, 57.320
dummydicom.vtk (1.5 MB)
Hi,
I tried the method that I told you but it only works in the oposite way, i.e., you can send the data from the plane to your points but not from the points to the plane…sorry for that!. However, I can see in your figure that you didn’t activate “Pass Points Arrays” ? Did you tried that?
Then I took a look to your vtk file and I found that you have:
DIMENSIONS 51200 1 1
I think that it would be smarter to create the plane directly in the vtk format instead of creating that in Paraview. You just have to define the number of points along each direction of the mesh:
https://vtk.org/wp-content/uploads/2015/04/file-formats.pdf (see page 3)
I tried this simple vtk code to show you the idea: (it creates a simple cell)
#vtk DataFile Version 2.0
VTK from Matlab
ASCII
DATASET STRUCTURED_GRID
DIMENSIONS 2 2 1
POINTS 4 float
0.0 0.0 0.0
1.0 0.0 0.0
0.0 1.0 0.0
1.0 1.0 0.0
POINT_DATA 4
SCALARS DICOM float
LOOKUP_TABLE default
0.1 0.2 0.3 0.4
So, in your vtk file you have to modify “DIMENSIONS 51200 1 1” and put the proper values of points along the axes. You have also to control the order of the points.
Good luck!
Miguel
Hi Miguel,
Thank you that’s exactly what I wanted! I guess I overlooked the .vtk generation step 
Many thanks for all your help.
Debbie
PS. The “Pass Points Arrays” didn’t work for the plane source method, but anyhow, creating the plane directly in the .vtk is much more efficient.