Hello Everyone,
This is a follow up to my previous post here
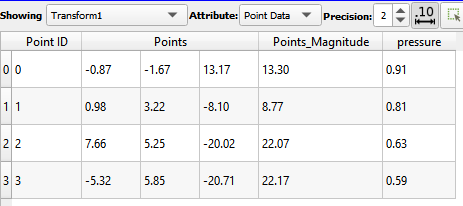
I have a parameter data pressure , obtained from a simulation, for certain xyz coordinates of a geometry (data: first snapshot and geometry displayed in second snapshot shared below).
I don’t have the field values at all points. The values are generated from simulations only at discrete points (x,y,z coordinates displayed in the snapshot below)
Following the instructions given here, I have used SPH Interpolation by adjusting the Spatial Step to interpolate the values of pressure at all points in the geometry.
Output from SPH DatasetInterpolator
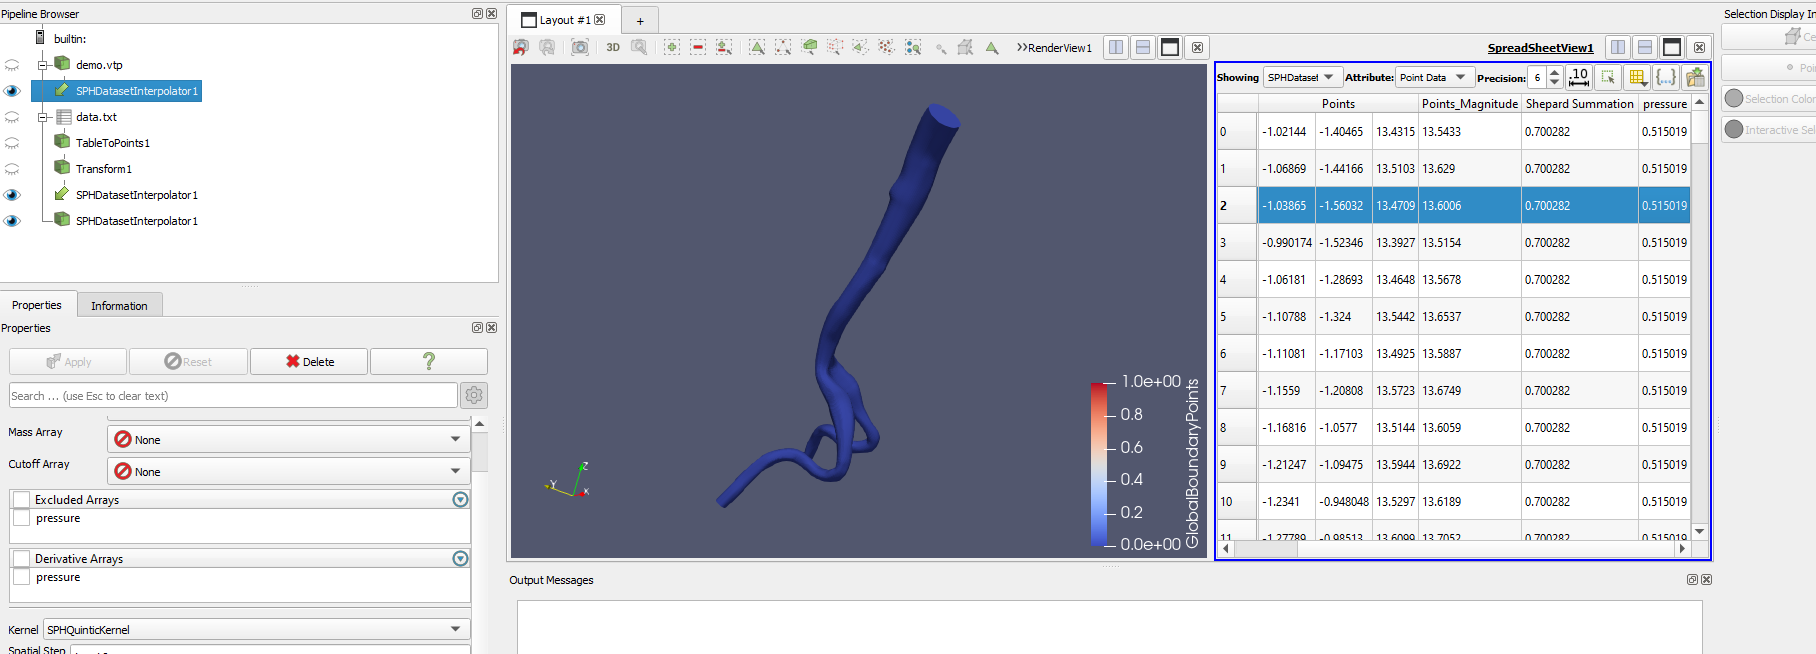
But these values keep changing when I keep increasing the step size. For instance , I am checking the values for spatial step size: 10, 100, 1000, 1000000. For any value greater than 1000 , the interpolated values of pressure are the same all points as displayed in the above snapshot. I’d like to know what’s the right way to fix this step size.
I would also like to know how to color the 3D geometry using these interpolated values.