Thanks a lot for the clarification.
I still have a few more questions. I’d like to use Point Volume Interpolator described in the documentation available here.
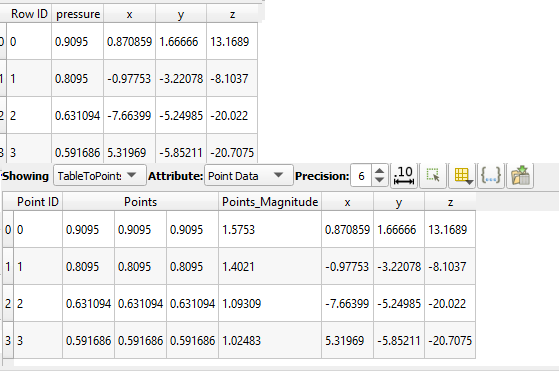
Yes, I don’t have the field values at all points. The values are generated from simulations only at discrete points (x,y,z coordinates defined in the snapshot below)

The table on the top is the input data and the table below it has been generated using Table to points. But I oculdn’t clearly understand how Table to points works and how to use Resample with Dataset filter. When I try to seelct Resample with Dataset from Add filters tab, Resample with Dataset isn’t available for access.
Could you please offer instructions on how to proceed from here?
cross-posted here