I have two spheres, which we will call “spheres” and “spheres2.” They are initially defined in two ways: first, via .csv files containing “position.x, position.y, position.z, boundingRadius,” and second, via .pt files.
The DEM simulation is computed using in-house DEM software, and in the end, we obtain .xdmf3 files that we can import and visualize in ParaView. This works perfectly fine. My current focus is on visualizing a specific aspect: I want to divide the heat conduction within the spheres into concentric shells.
In this case, the heat transfer occurs from one sphere to the other. To visualize both spheres initially, I need to set the representation to “Point Gaussian” and the boundingRadius to 0.03 to ensure they are displayed correctly—or even visible at all.
When I load and inspect my spheres.xdmf3 and spheres2.xdmf3 files in ParaView, I see that they contain the following parameters:
innerTemperature (Magnitude, indexed from 0 to 9)
shellsOuterRadius (Magnitude, indexed from 0 to 9)
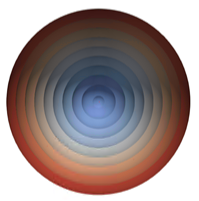
I would like to visualize each sphere individually, displaying the concentric shells and their temperature evolution when I press “Run.”
The attached link contains the mentioned .xdmf3 data.
the files P0/ld_*.h5 are missing. Could you please share them?
Not sure about your expectation about visualization, but maybe looking at using a scale array for the Gaussian Radius of the sphere would help visualizing the shell structure?
If I understand correctly, you have one point per sphere with a point data containing the radius (but the shared data contains only one point per dataset, so one sphere only).
So, I would suggest to use the Glyph Filter with the Sphere Type, and set the scaling with the boundingRadius array. Then you may use the Clip filter to reveal the inner and get the expected visualization.
First of all, thank you for your help and I apologize for the late reply.
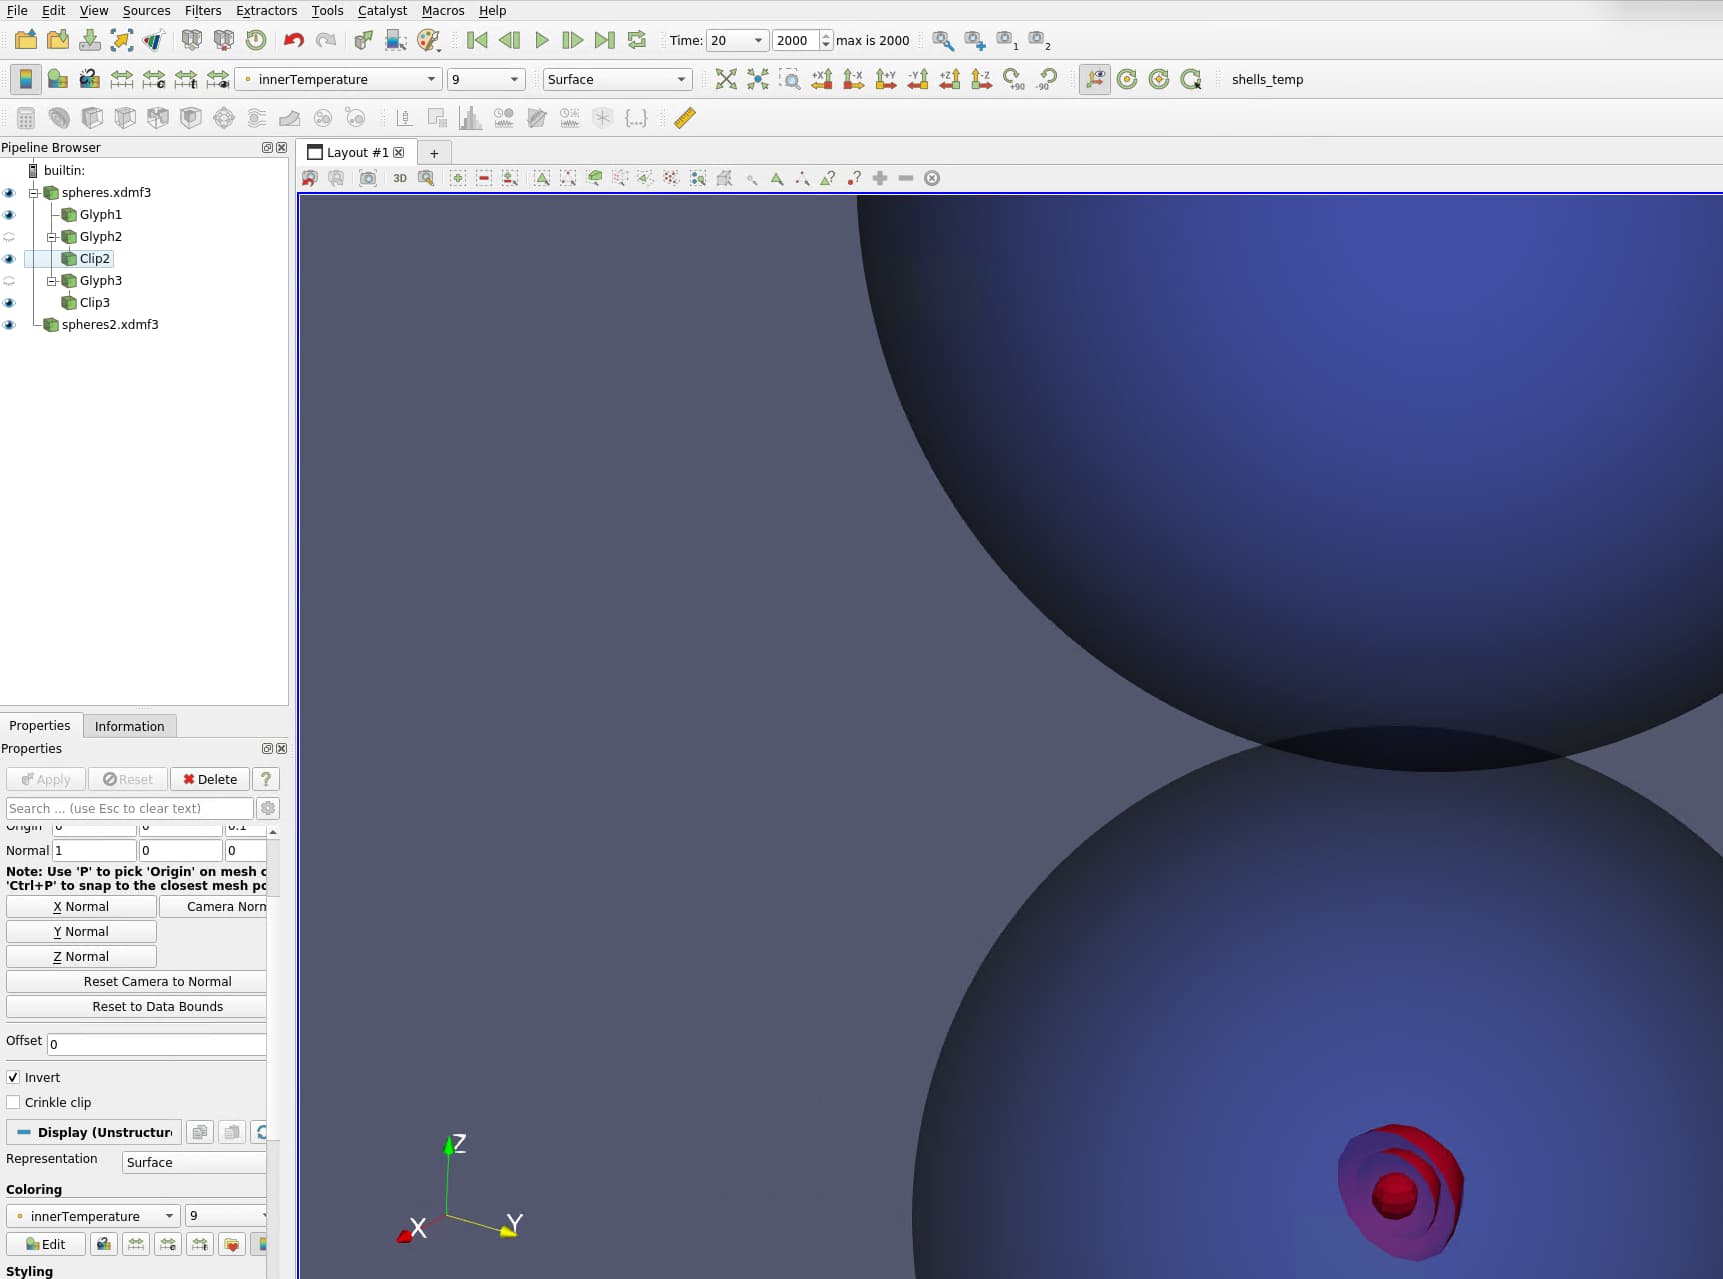
Your answer, if I have understood it correctly, is already going in the right direction. I loaded both spheres*.xdmf3 and applied the filter glyph of type “Sphere” to one of them as an example. I did not clip the innermost one (Glyph1) but then the second and third.
I gave the glyphs a scale factor of 0.1, 0.2 and 0.3, as I know that my “shellsOuterRadius” have a radius of 0.003, 0.006 and 0.009 respectively.
I think due to the fact that the spheres are point data and not volumetric solids, I have to live with the fact that you can’t see an actual cut surface, only the surface (see screenshot)
.
However, my current problem is that all my glyphs or clip filters always assume the same value innerTemperature_i as soon as I change one.
For example, I want Glyph1 to take the coloring from innerTemperature_1 and Glyph2 or Clip2 to take the coloring from innerTemperature_2 and so on.
I am still at the beginning of my ParaView experience and think and hope that this is a typical beginner problem
Alright, for the current problem, I found the following solution:
To give every component (filter) a separate coloring, you can click the “Use separate color map” button to select a different color map to each object in the pipeline browser.