I am using a .vtk file that has many isolated points and i wanted to visualize them. However, some points can have the same coordinates. Only one point with the coordinates is shown. But in the SpreadSheet view, all the points are there. I want to visualize all the points with the same coordinates, because i need to visualize the points’ ID, even if the texts overlap.
Can you help me, please?
Thank you,
Marina
Marina,
Are you saying that you want to display the IDs of all the points, including the coincident points, or are you saying you need to isolate just points that are coincident for some processing??
Dennis
Dennis,
I want to display the IDs of all the points, including the coincident points. This is for the presentation of some results, being necessary to appear all IDs.
Thank you,
Marina
Marina,
Perhaps too obvious, but did you modify “Maximim Number Of Data Representation Labels” in your Settings/General? I’m not sure if this is what you are seeing if this number is less than the number of points in your dataset.
Dennis
Dennis,
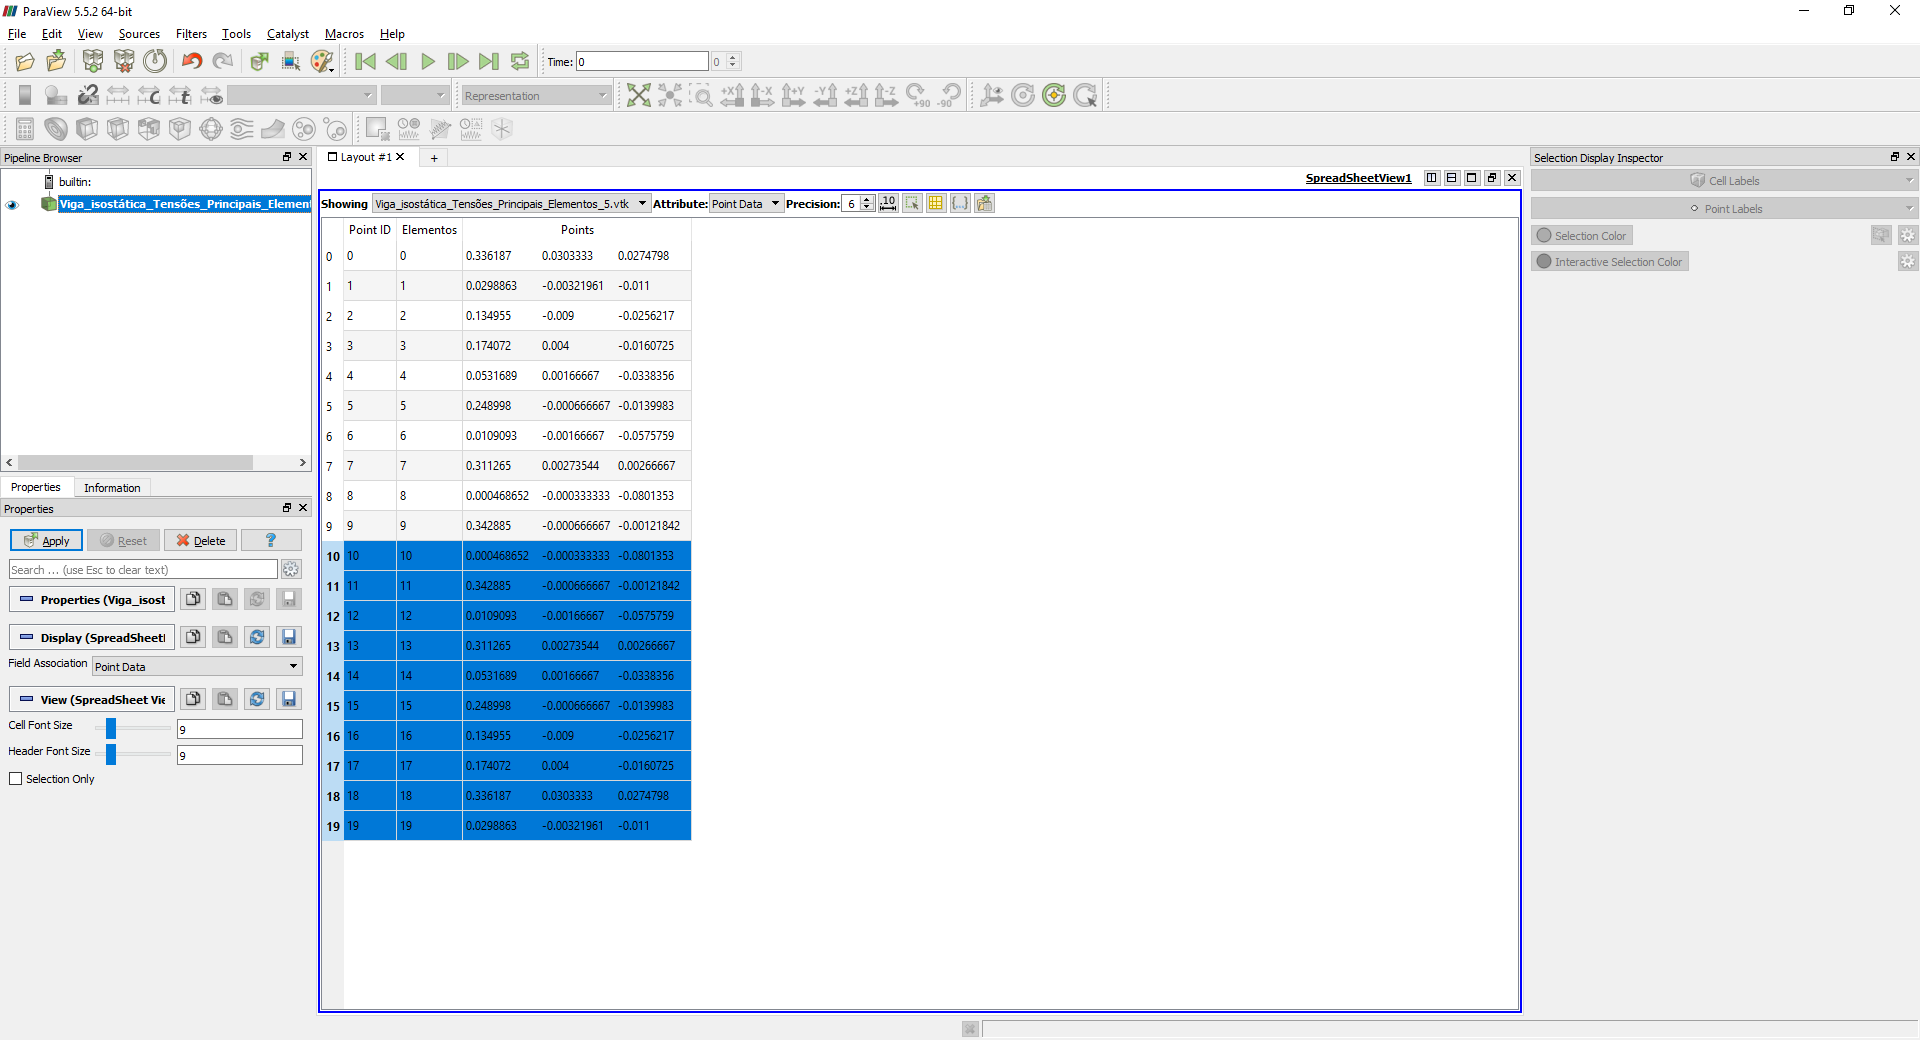
For now, I am in a testing stage, so there a quite few points (20). The limit é 100.
I can only see 10 points, because the other 10 have equal co-ordinates. See the figures below.
Thank you,
Marina
Marina,
This is another reason I think Cells and Points should have string variables. If that were true then you could:
- Run a filter to determine the distance to the nearest node for every node in your set
- Run a filter which creates a new variable StringID
For Points with non-zero distance to nearest node, StringID is set to str(GlobalPointID)
For Points with zero distance to nearest node, StringID is set to str(GlobalPointID)+’, '+str(NearestNodeGlobalPointID)
Then you would choose StringID as your Point Display variable
Right now I can’t think of any way to do what you want though!
Sorry
Dennis