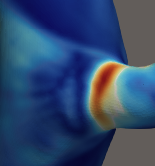
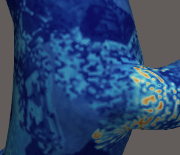
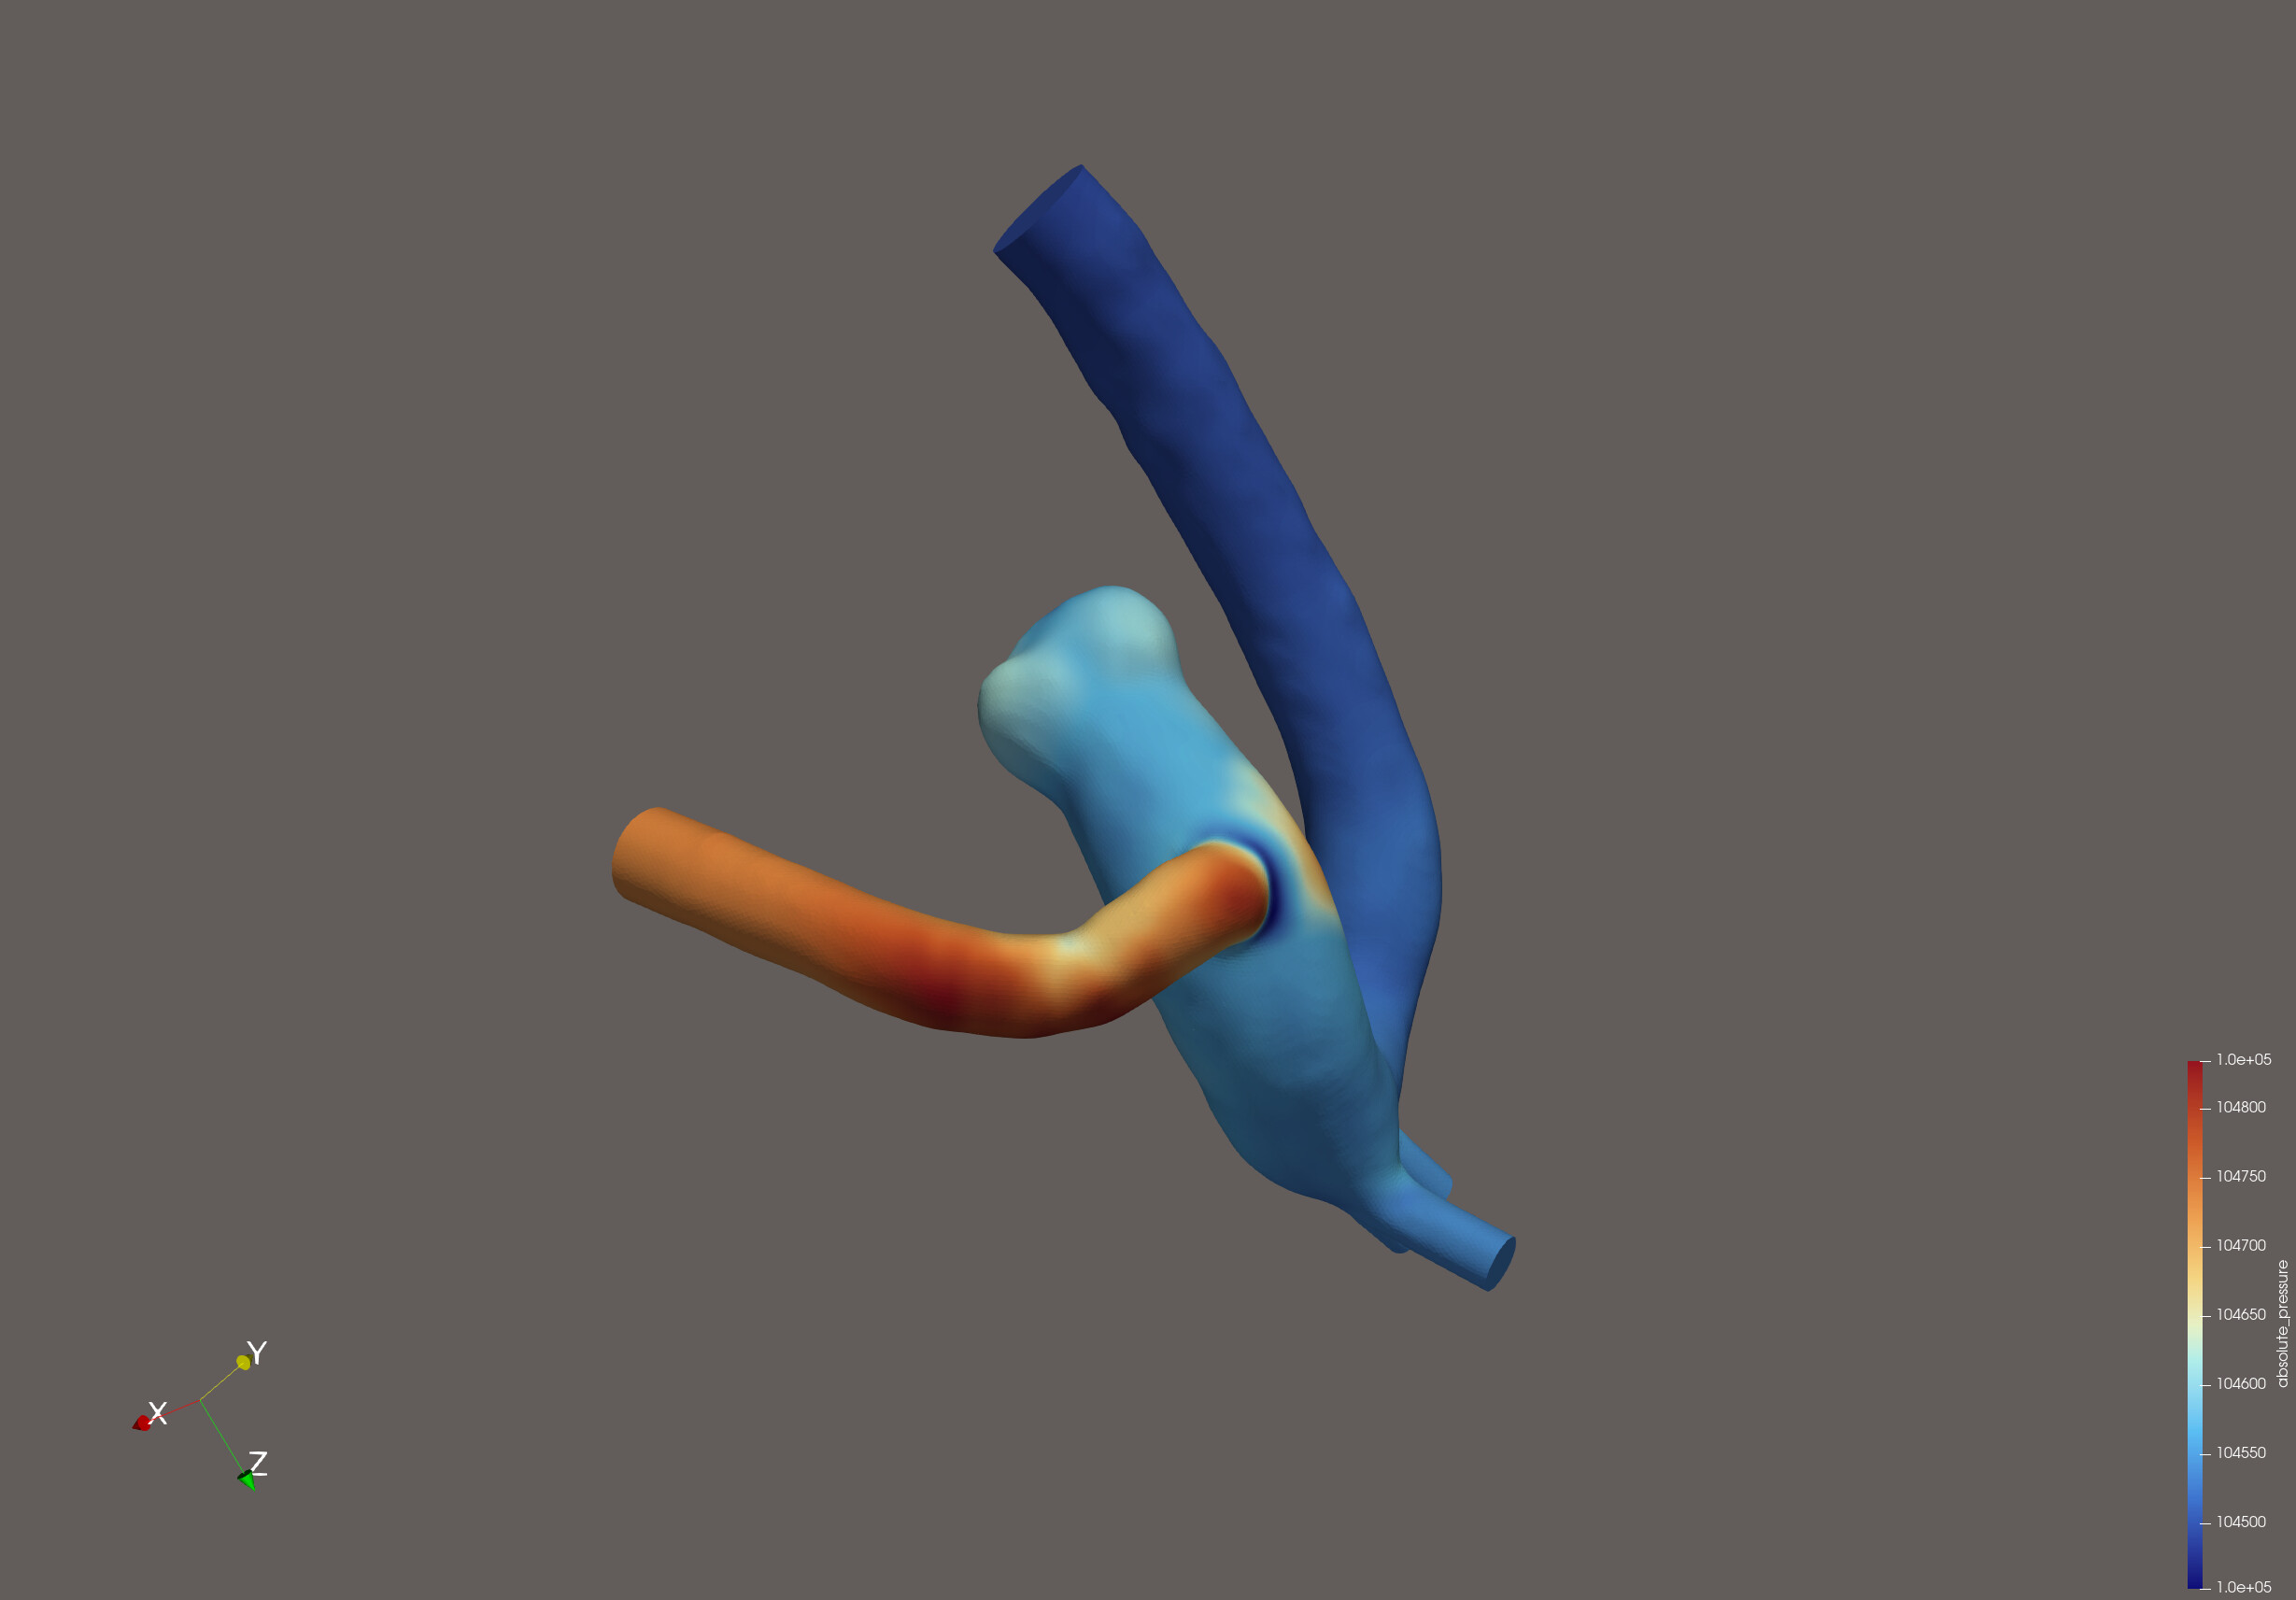
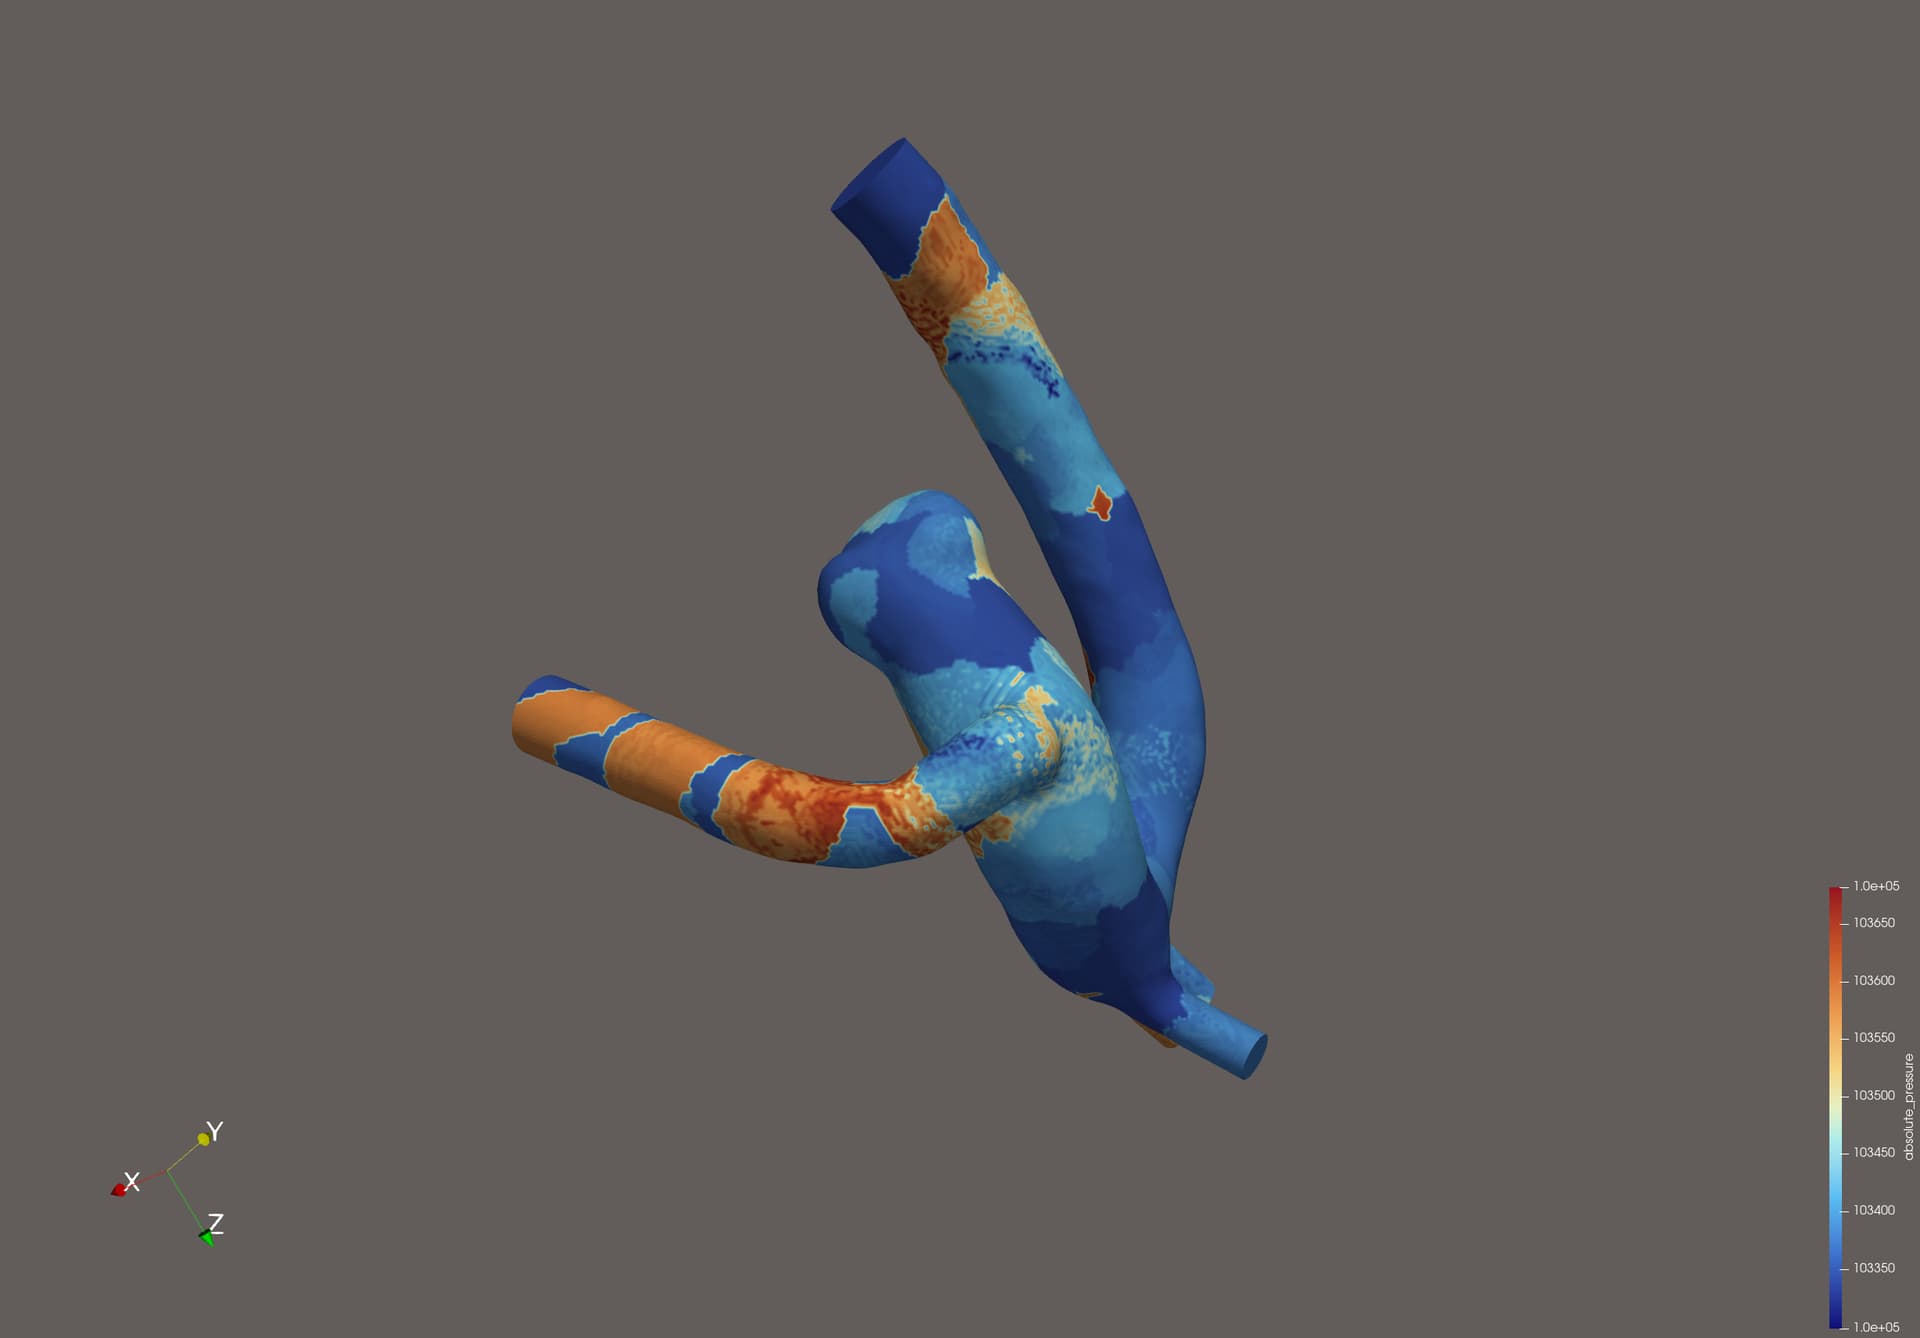
I am exporting my data from Fluent in Ensight Case Gold binary format using location: Node. The data for multiple cluster runs is stored sequentially. However, the data from the first 1 s (i.e., the first run) visualizes correctly and smoothly, while the data from subsequent runs (at 2s) appears distorted or pixelated, as shown in the attached file.
The .cas and .dat files saved by Fluent after a run are all correctly visualizing. However, the problem, as far as I understand, is that the underlying mesh indexing or how the data is stored in the subsequent cluster runs is not consistent with the initial run’s geometry (the original .geo file). As you can see, timestep 3 marks the end of the first/initial run, and from 4 onward, there’s the subsequent cluster run.