Hello everyone,
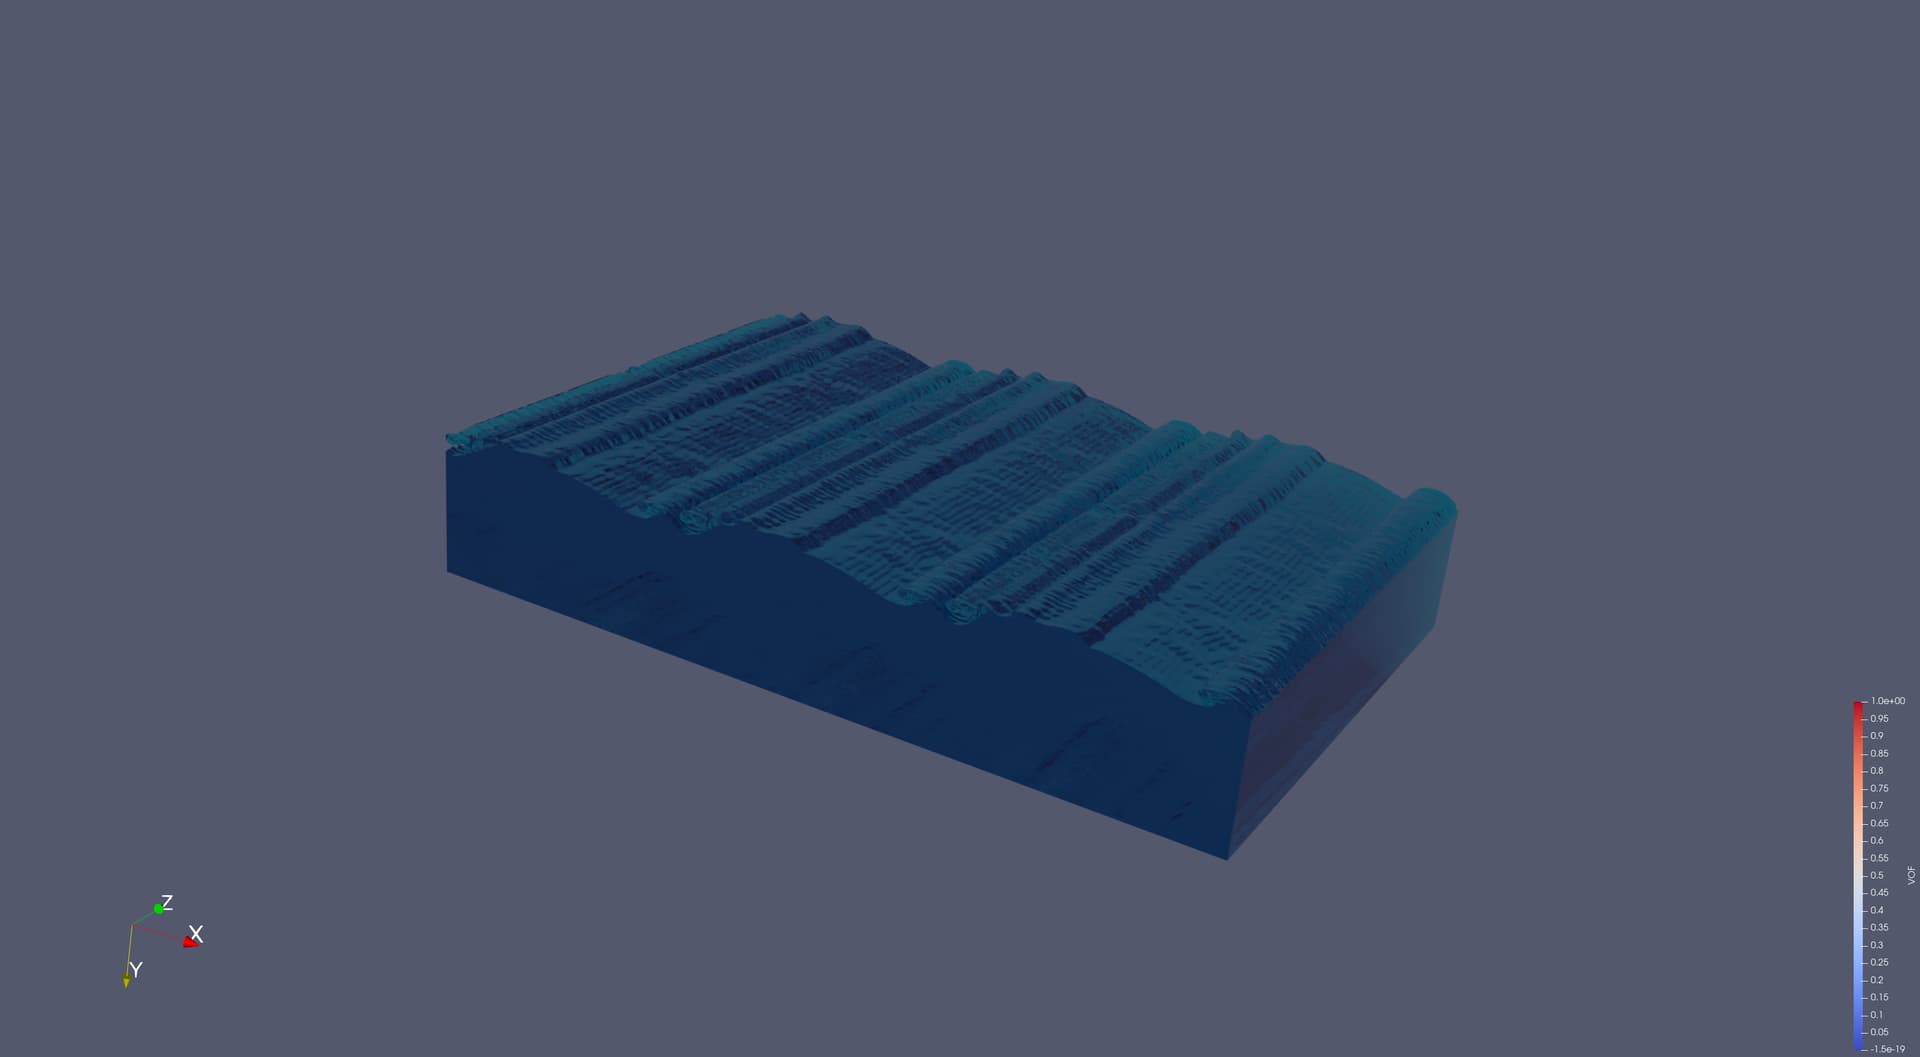
I am a beginner in using Paraview for visualizing wave breaking. I would like to use Paraview with an input file that contains volume fraction data for all cells at their centers, where 0 represents air and 1 represents water (as vti file format).
I have attempted to visualize the data using Paraview, and the results are as follows:
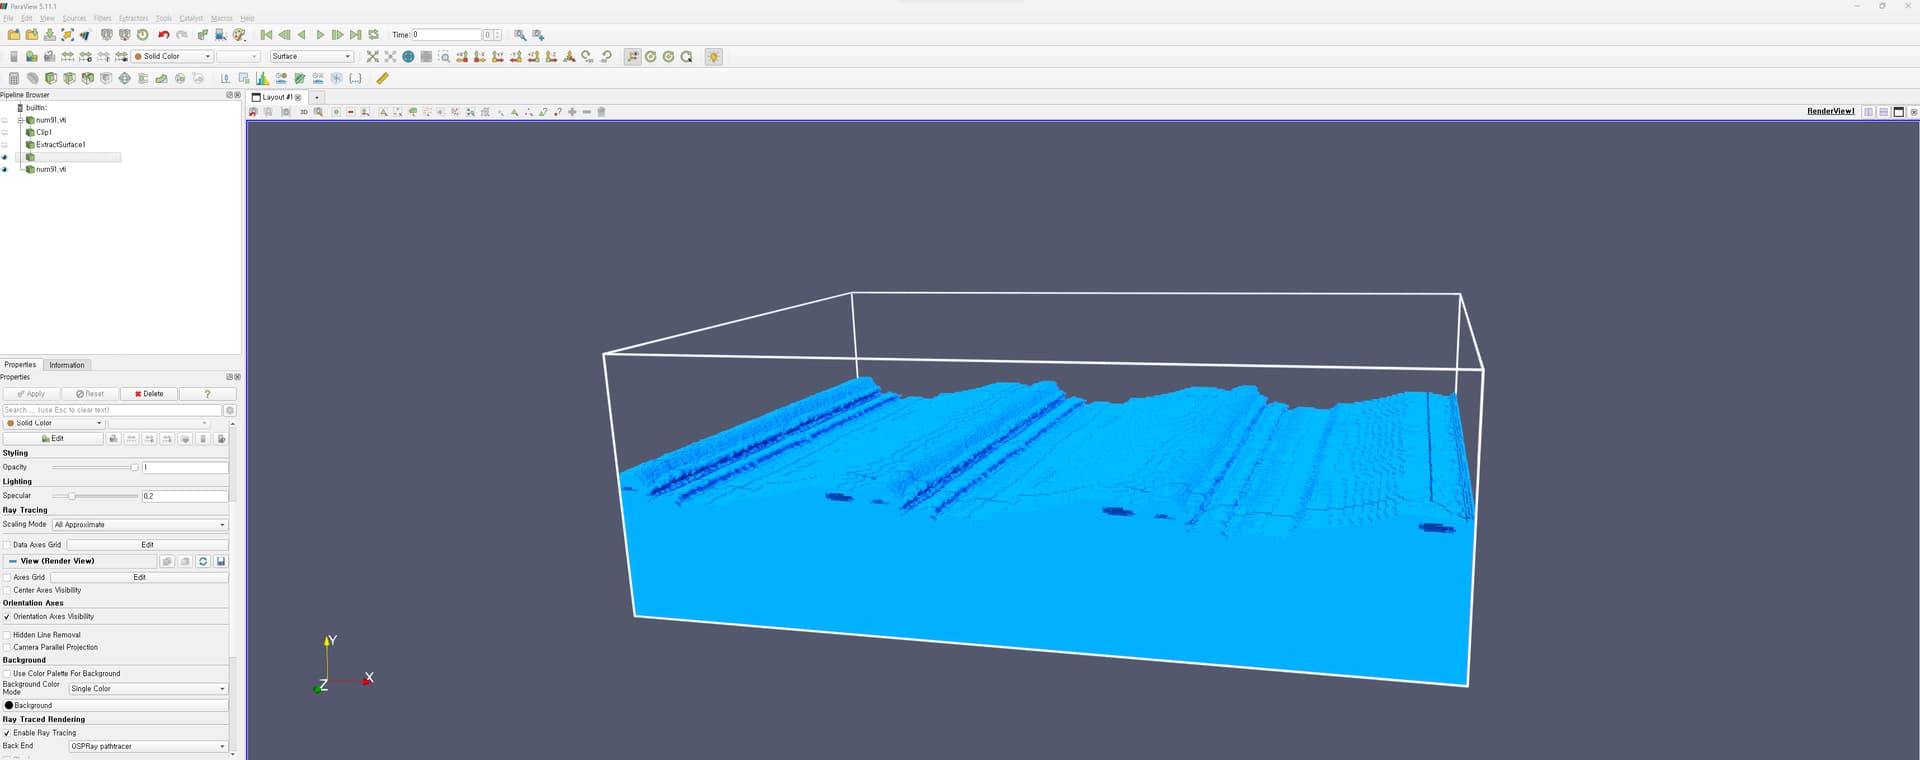
“Clip:Scalar for interface, 0.5”, “Extract Surface”, “Generate Surface Normal”, “OSPRay pathtracer”
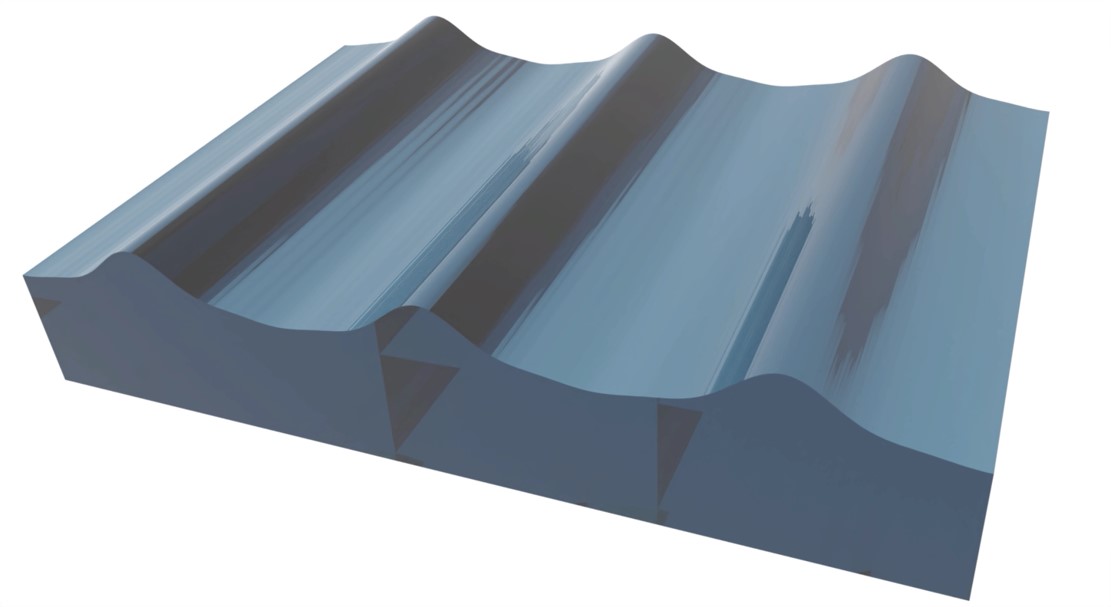
I am seeking advice on which features or functionalities I should utilize to achieve the desired results, which can be seen in the example provided.
Thank you very much.
Regards,
Sopo.