I’m loading a .vtu file of a vertebra mesh in Paraview. In my python script, i’m computing the center of mass and the principal axes of that mesh. I would like to visualize the Center of Mass as a sphere and the three principal axes as three Arrows, similar to a coordinate system. How can i do that in the Paraview GUI itself? I’m aware that it’s probably possible to add those objects in the .vtu itself, but i would like to do it manually first, also to be able to interact with the input values directly.
Right, this is too complex for what it should be, but you can use the Transform filter to position the Arrow where you want.
Another way to do this would be to use PointSource and a Glyph filter with orientation, assuming the vector are available in the data directly as point data.
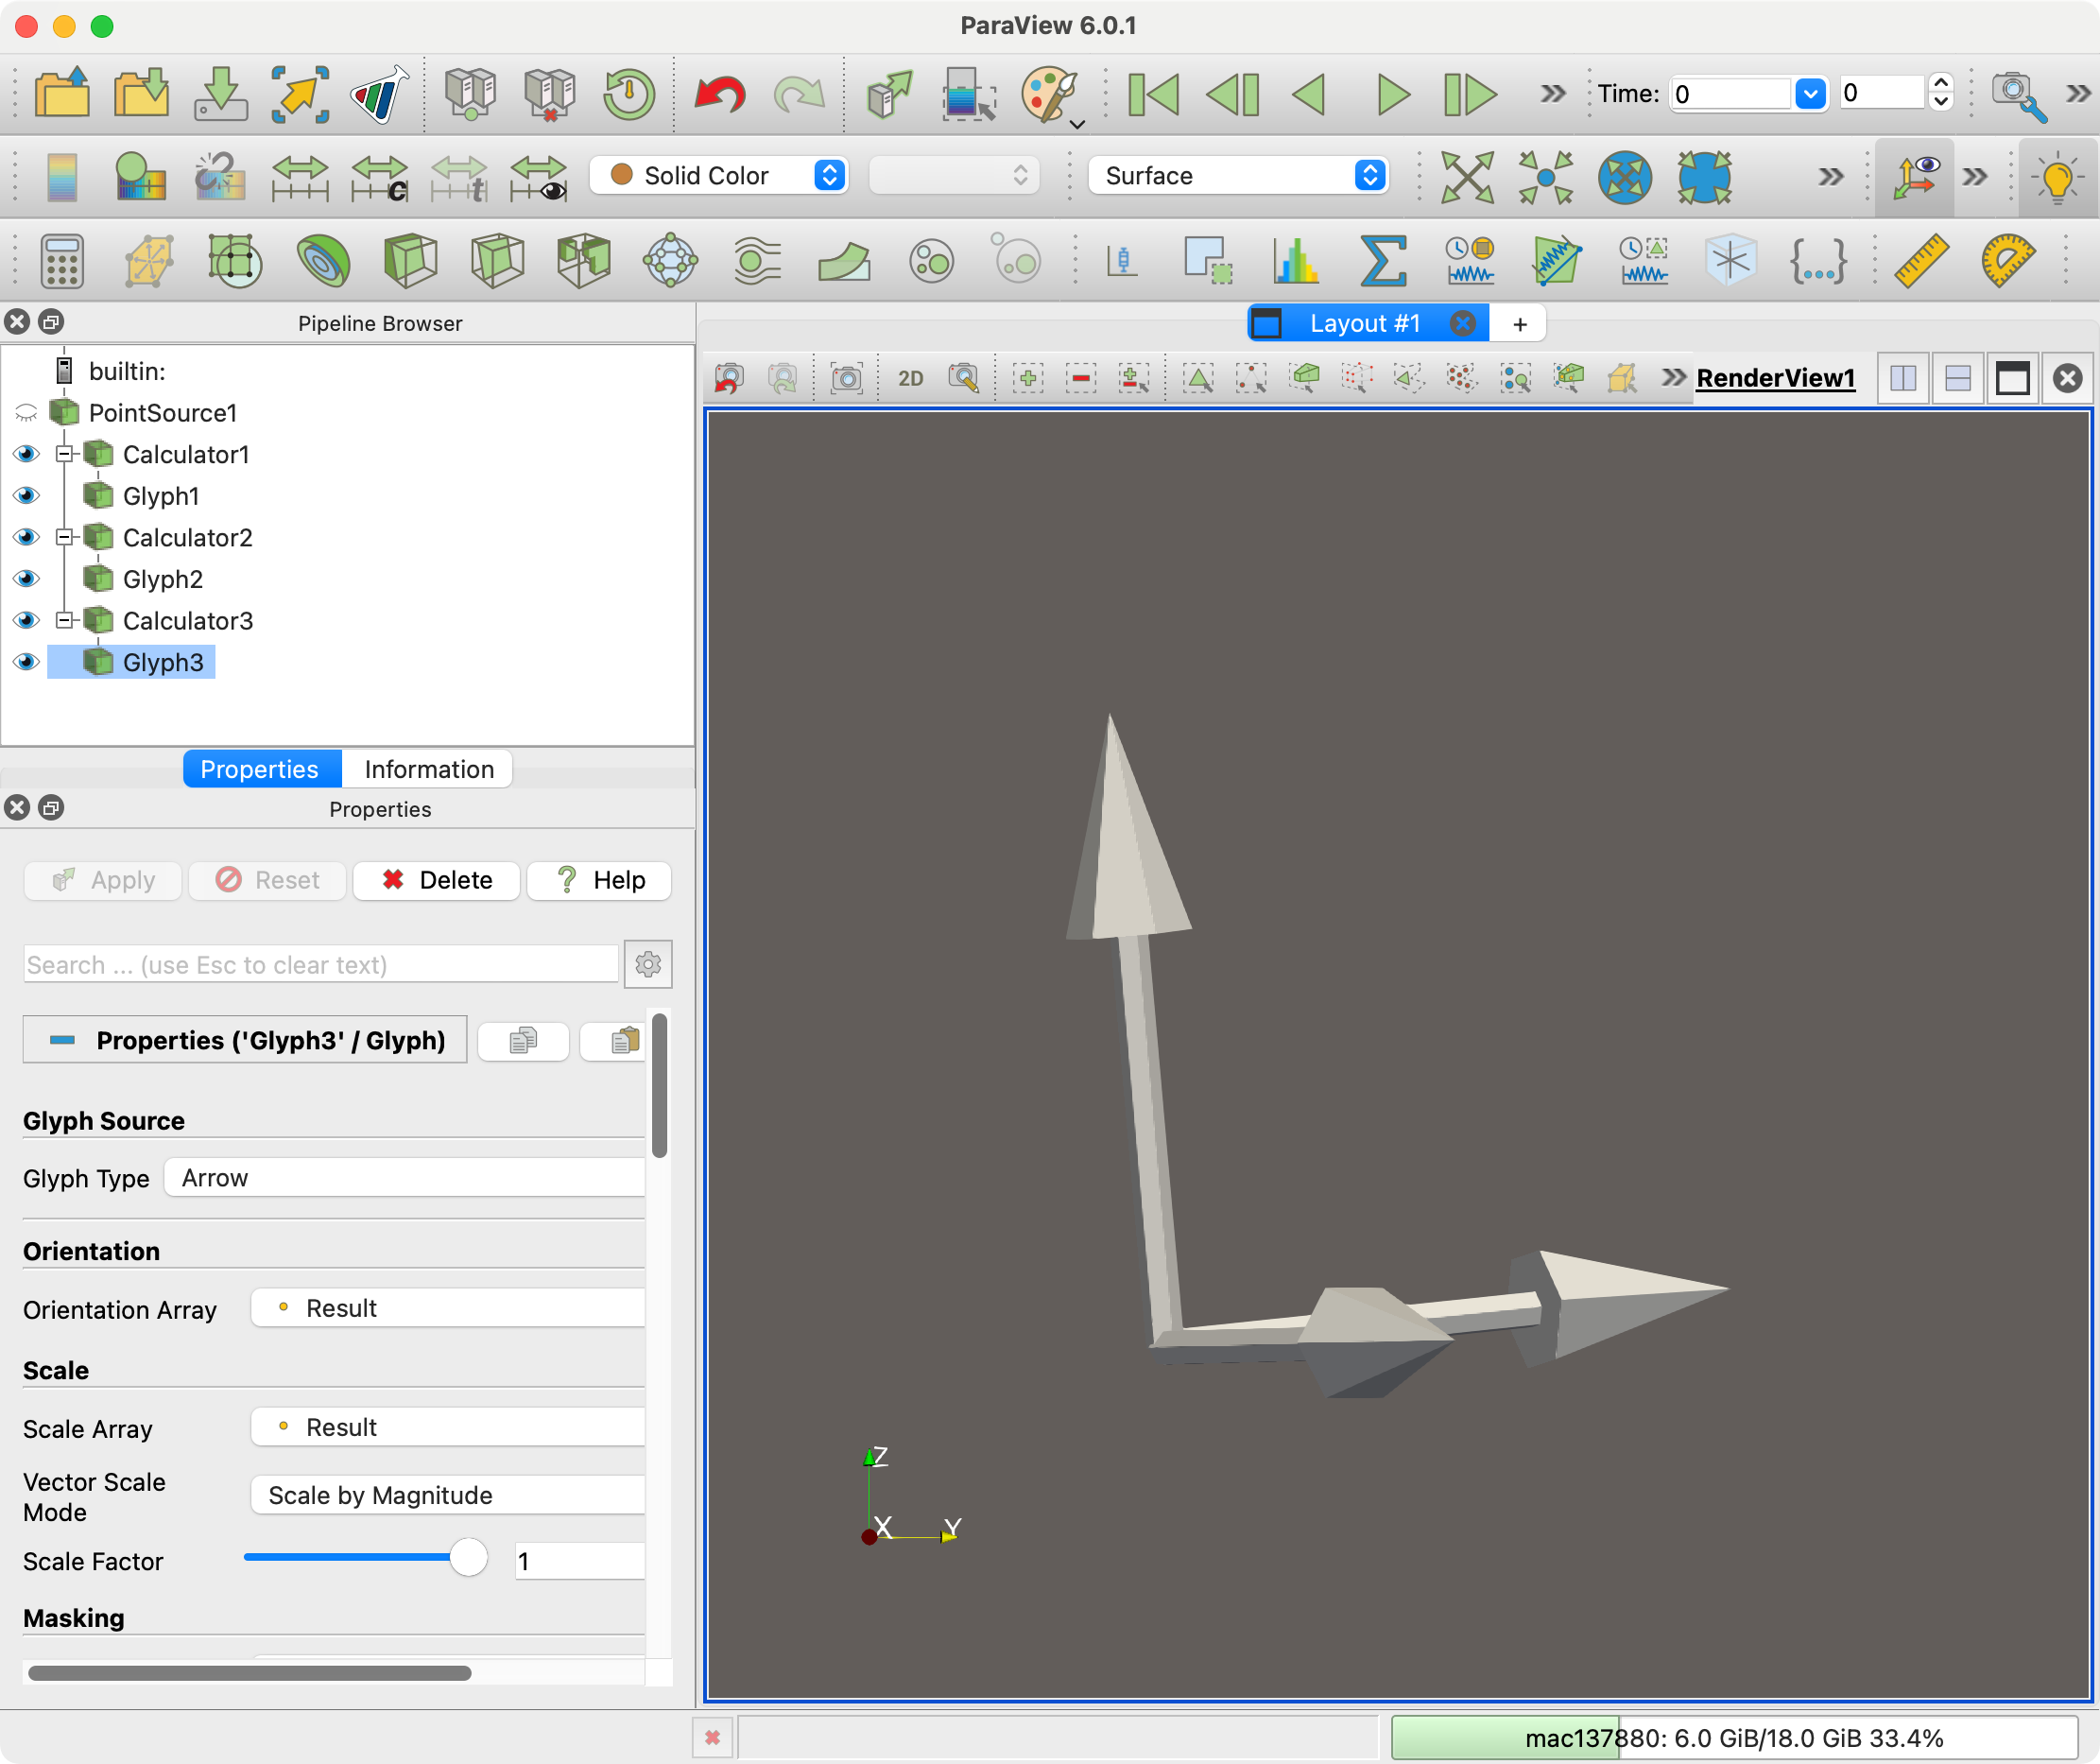
OK. This is stupid, but if you don’t want to figure out the rotations for the principal component vectors, you can use the point source to create a single point at the origin, then the calculator to define the direction of the vector, then the glyph filter to draw an arrow orientated and scaled by this vector. Here is a state file that does that: pca-rep.pvsm (933.4 KB)