I am new to ParaView and want to visualize the stress tensor in a NetCDF format file. My steps so far are as follows:
1.Convert the .dat0 file to NetCDF format.
2.Load the NetCDF file in ParaView using the NetCDF reader.
3.Use the contour filter to visualize it, and choose Szz. The result is shown in Fig. 1.
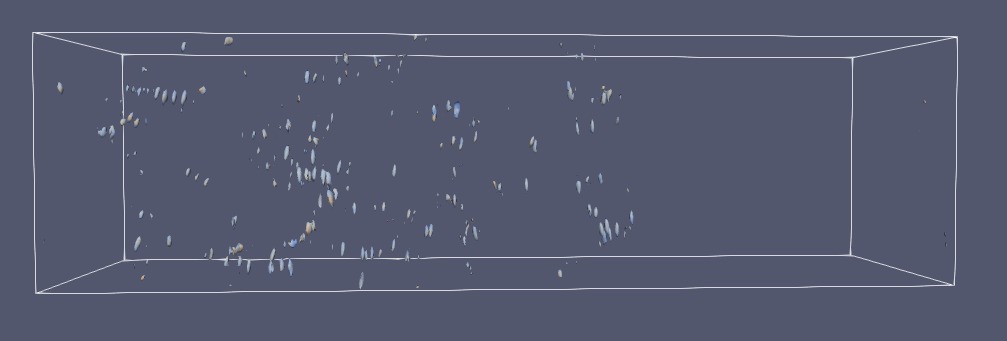
However, I want to display the data as shown in Fig. 2. How can I achieve this? Do I need to change filters or make other adjustments?
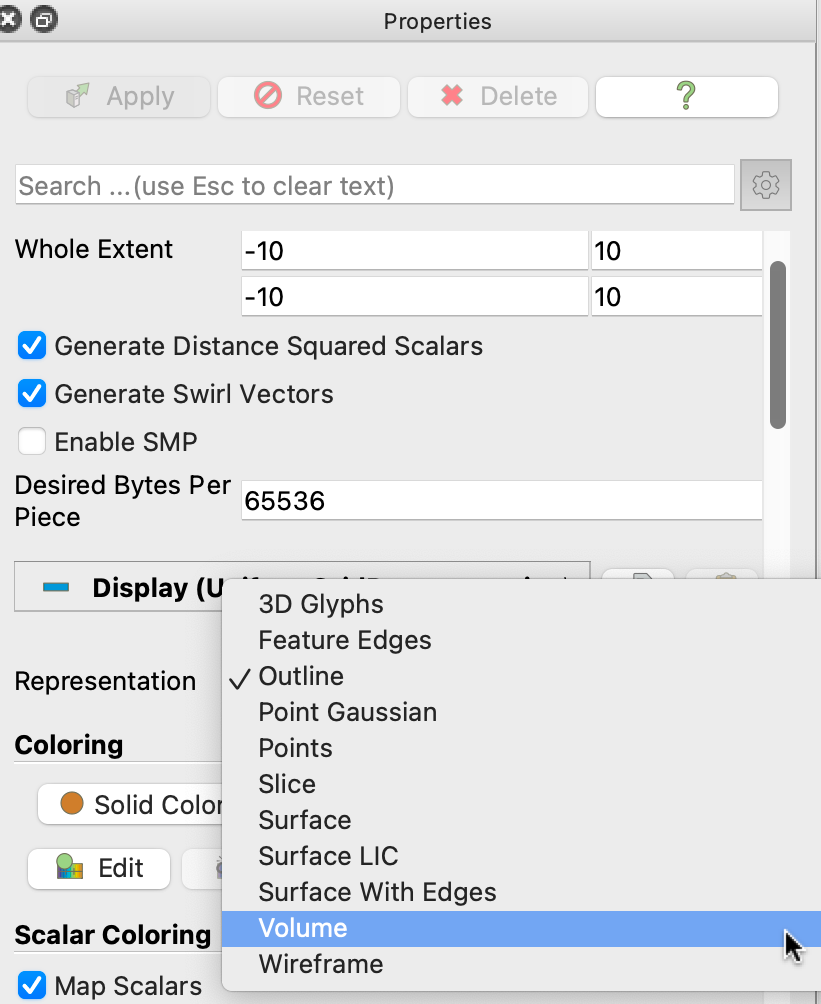
The second image appears to be a volume rendering of the data. To do volume rendering in ParaView, you change the type of representation used for the data. In the Properties Panel, look for the Representation property in the Display section: