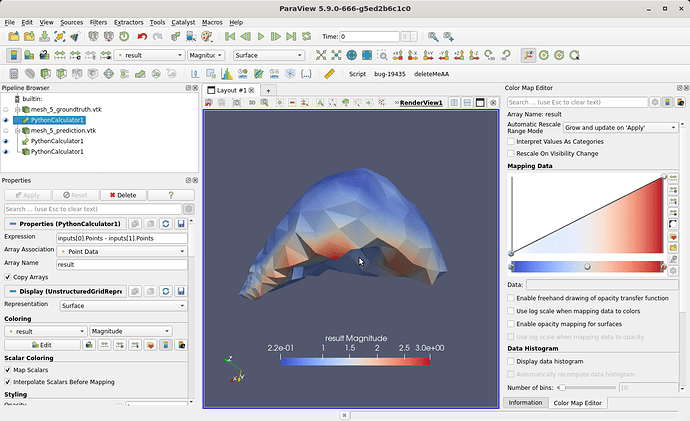
I have two volumetric liver meshes in .vtk format (i.e. ground-truth and predicted versions) and now I want to plot the error i.e., for example, the difference between the ground-truth and the predicted liver meshes on the predicted mesh / mesh coordinates with a different colour (colour code based on displacement magnitudes) to visualize how much deviation that each point has ? Is it possible in Paraview ? If so can you elaborate the steps with an example please ?
I have herewith attached two samples .vtk files for your further reference.
sample_data.zip (80.7 KB)
