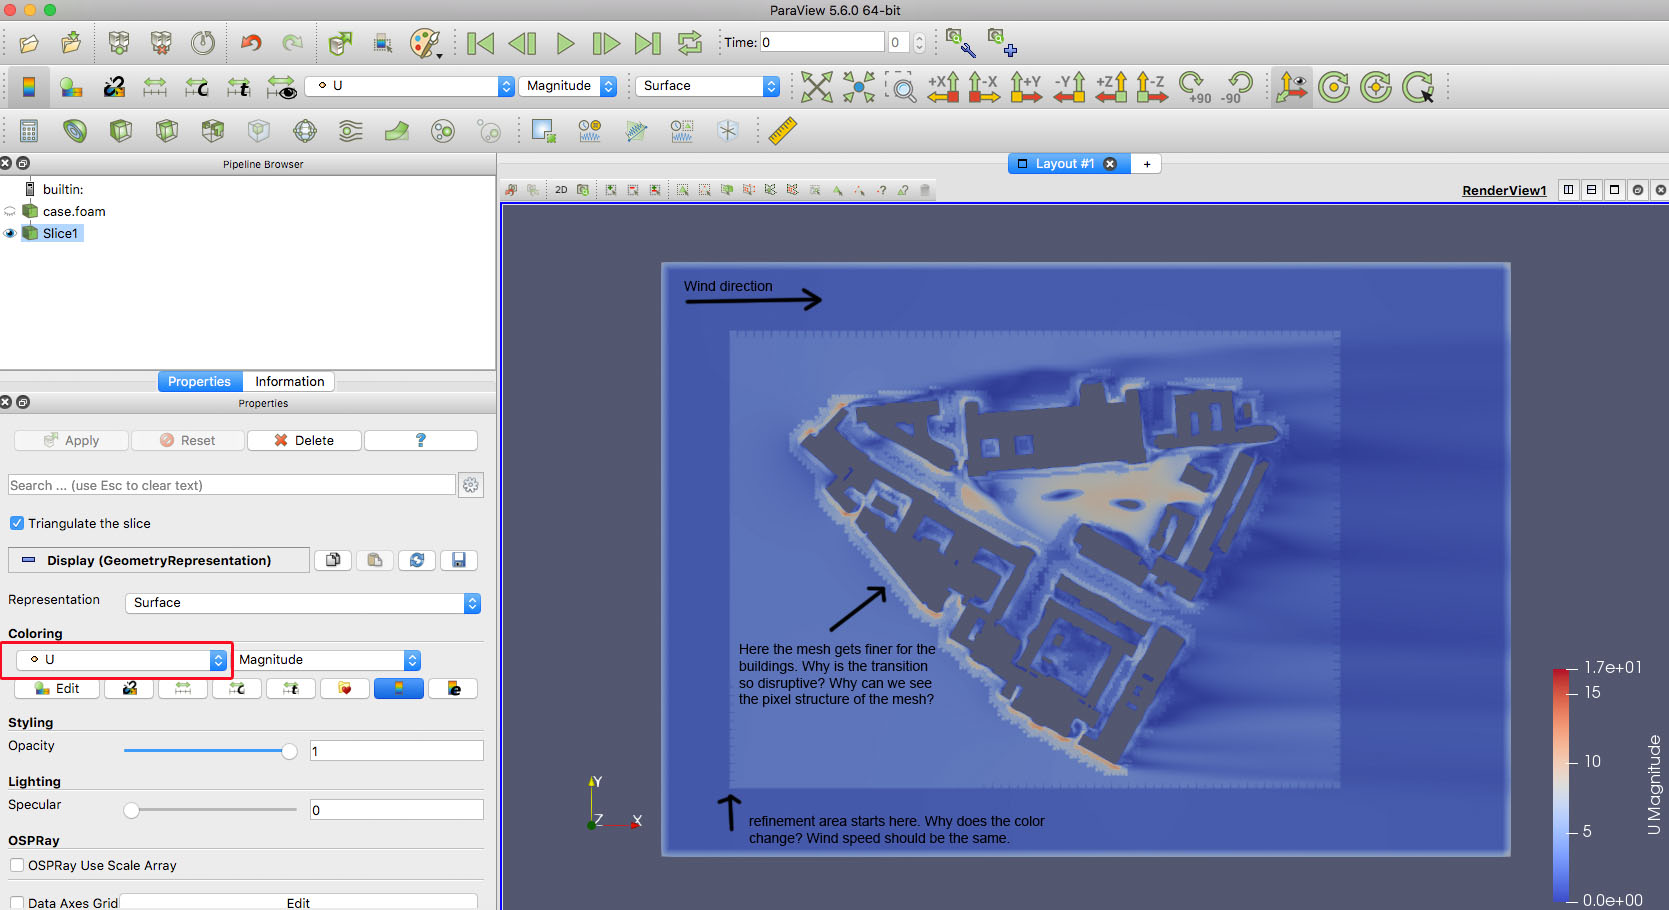
I am working on a wind study within an urban context. For meshing and simulation I used simscale, now I want to visualize the results in paraview. For doing so, I set a slice in z direction, hight 1.5 m as I want to show the effects for humans. As I want to show wind speed, for coloring I selected “U” and “magnitude”.
There are two different U options, one with a orange dor, the other with a box. I understand, that U with a box shos the exact cell data, while U with a dot shows an averaged value.
For my example I would like to use the averaged option, but the transition between buildings and open space doesn’t seem to be right, as it is heavily disrupted by the blockMesh structure. Also, the transition between the base mesh and the first refinement area shows the same problem.
When showing PointData (the U with a dot) ParaView interpolate the color between points.
The artifacts you are seeing only means that your point data contains differente values between points and ParaView does its best to show them.
A solution could be to add a CellDataToPointData that will actually remove your current point data and compute one based on your CellData (data with the box).
Hi,
are you sure that both variables, point and cell, represent the same data? The range of the colortable is the same in both images, but it looks like that the inward wind flow for point data is around 5 m/s, while for cell data it is 10 m/s. I also visualize wind speed a lot, but from other models. I usually have to use the calculator to combine three scalar fields into a vector, and only then I can select either the Magnitude or the vector components. Did you create this vector, or is that a feature of your data set?
Cheers, Niklas
Thank you very much for your advice. The CellDataToPointData filter works great and the result looks good.
Do you have any idea, why the original PointData (before applying the filter) gives such a different result than CellData? As also Niklas mentioned in his reply, it seems wierd, that inward wind flow for point data is visualized as 5 m/s, while for cell data it is about10 m/s.
Hi Niklas,
thank you for your reply. I did not combine different scalar fields, U magnitude comes directly from the data set. However, I was wondering about the same question (inward wind flow for point data around 5 m/s versus cell data 10 m/s). As the dataset has been generated in simscale, I will get in conctact with the simscale support.
Best