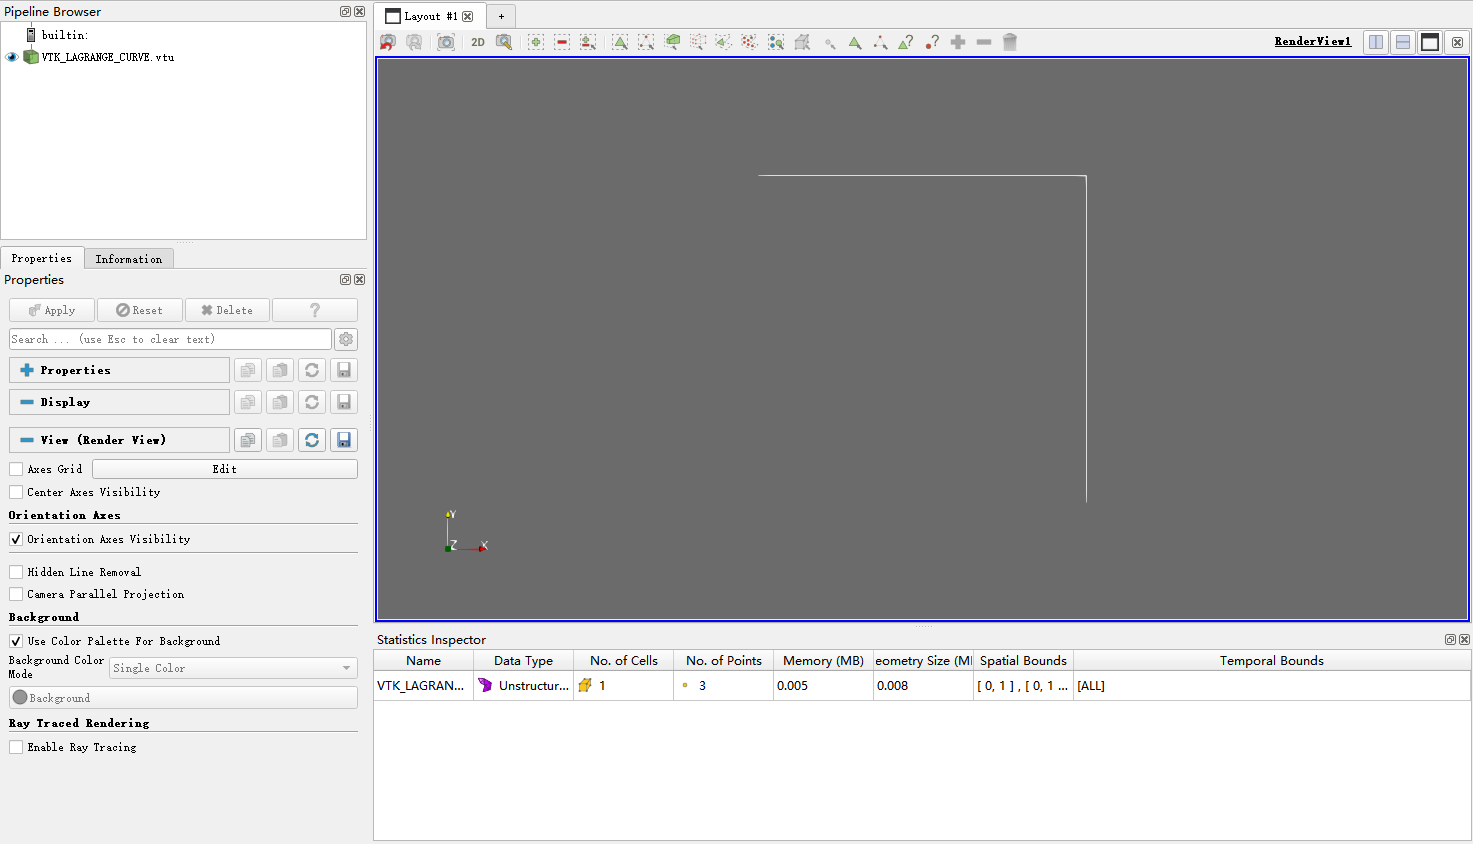
I have a vtu file that contains a Lagrangian curve, but when I import it into paraview, I find that the visualized result is a broken line, what should I do to visualize it as a curved line.
Welcome to the ParaView discourse! Thanks for posting your question.
Is it possible for you to share your data set?
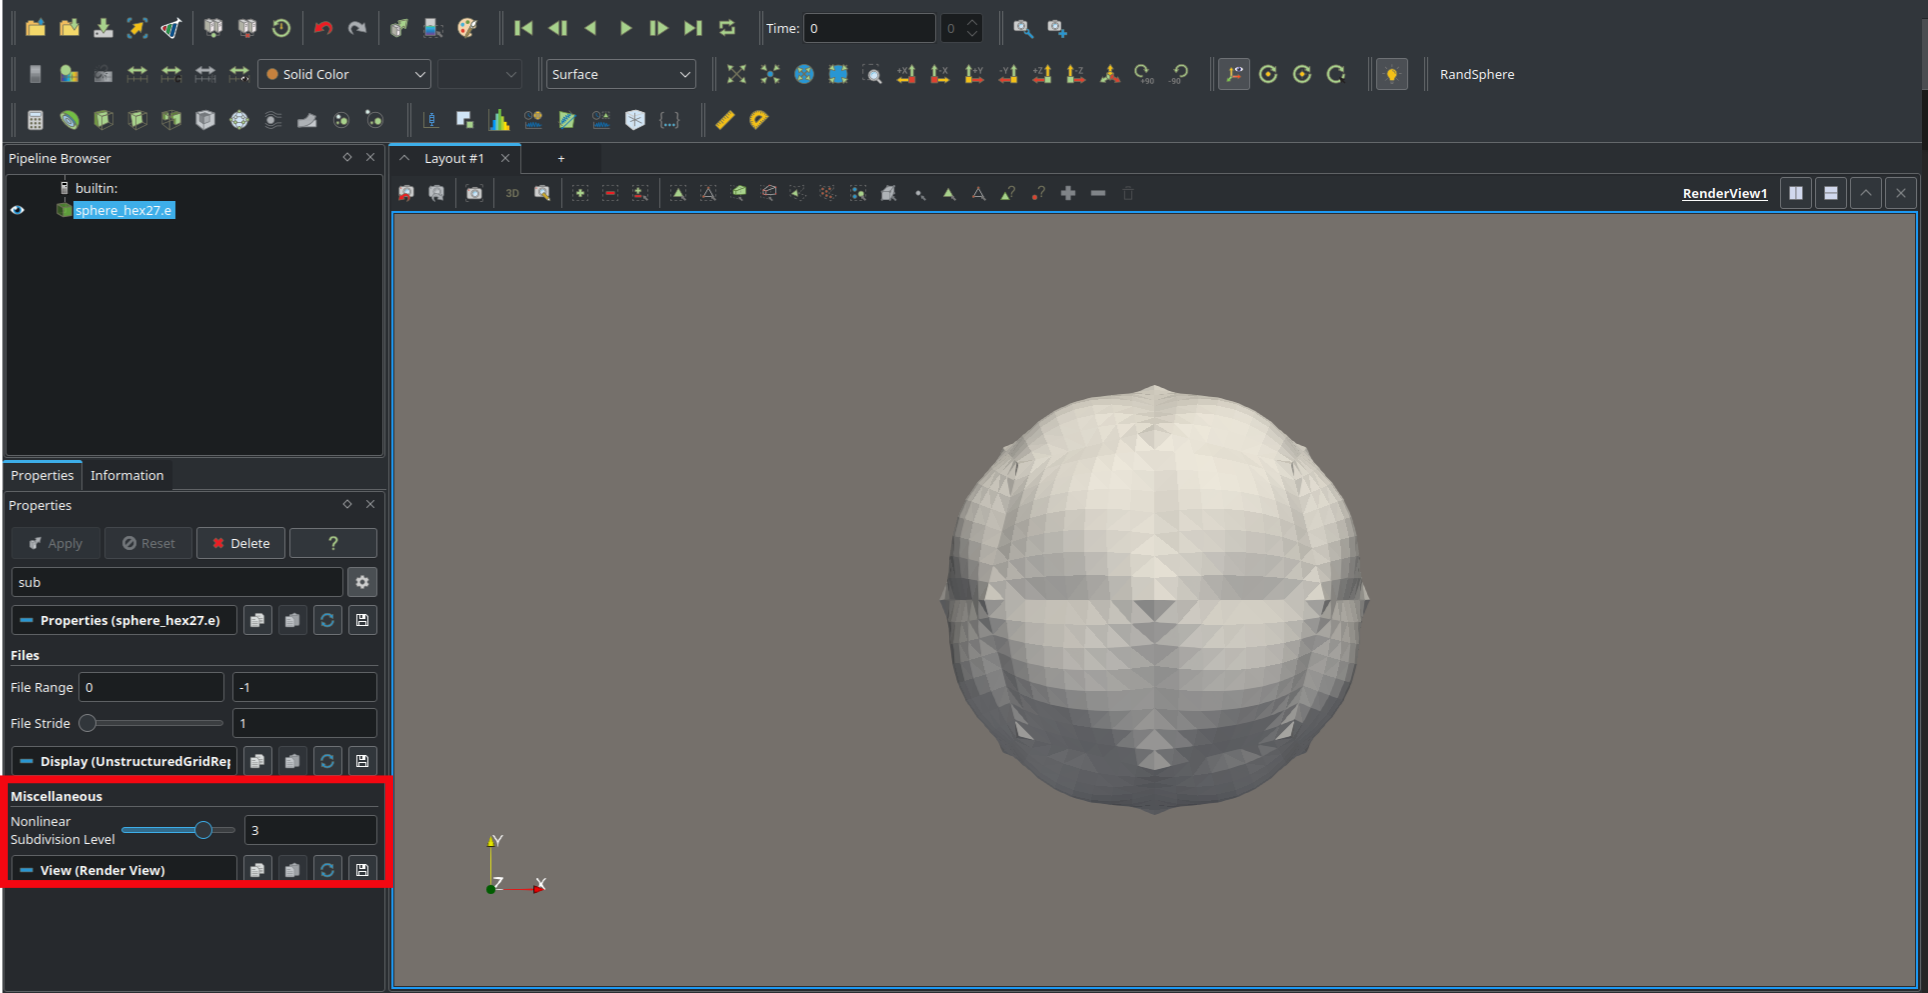
I think the answer you might be looking for can be found in the “Nonlinear Subdivision Level” property in the Miscellaneous section of the “Display” properties.