When I filter my data with threshold filtering for one attribute, sometimes only one point have that attribute in aspecific range. I have problem visualizing a single cell! When I check “All Scalars”, it does not show any cell (because only one point of the cells have that value). When I uncheck “All Scalars”, all the cells share that point on the corners become visible. I want to visualize only one cell that in the positive directions. Does anybody have any idea?
Thanks,
Javid
As you have discovered, the Threshold filter will extract all cells incident on points that pass the range when All Scalars is unchecked. There is no way to have Threshold extract only one incident cell per point. I’m not even sure how it would know which one you wanted.
That said, after Threshold runs it should be pretty easy to extract only the cell you want. There are numerous ways to extract cells in ParaView, but probably the easiest in your case would be to select the cell in the 3D view using  and then running the
 Extract Selection filter  .
.
Thanks for the response!
I have thousands of the cells and selecting them manually would not be feasable option.
I found that PointDatatoCellData could be usefull, however it averages the point values from the corners to the cell value at the center. If I can find a way to copy the point data to cell data which I can define which point to be choosen to be copied to the cell value, I can solve it.
Do you know any way similar to PointDatatoCellData filter that I can have more options to do it?
Or is there any way to access to the code behind PointDatatoCellData that I can program it myself rather than averaging the point values?
In short, I know of no way to do that directly. You could of course make a Programmable Filter to do whatever you want, but that is tricky if you are not very familiar with both Python and VTK programming. I expect you will also run into issues with point data that just gets dropped because there are fewer cells than points.
May I suggest that maybe you are looking to do something other than what you are asking. Do you really need to pull out a cell incident on a point, or are you really just trying to get to the point data itself. Perhaps it makes more sense to threshold the points themselves rather than the cells attached to the points. There are multiple ways to do this, but probably the easiest is to use the Find Data panel  to select points and then
 Extract the selection into points.
I use a software called Compucell3D and it has its own visualization program which is limited for post processing. The outlets of this software are .vtk files and I want Paraview for post processing.
I made a simple example to show what I want to do (attached). Compucell3D’s visulaization shows 4 cells (blue) and 1 cell (green) (attached). I want to have a similar result from the Paraview. Do you know how can I do that?
Step_000010.vtk (4.0 KB)
Thanks for sharing your data. That helps.
As I suggested in my last response, the image you are showing from Compucell3D is not showing cells. The cells in your data are axis-aligned cubes; those are octahedra. Your visualization is showing points using octahedra glyphs.
You can replicate the behavior in ParaView as I suggested before by extracting points that match your criteria. You can then use the Glyph filter to create icons like you see there. My previous response suggested using the Find Data dialog, which is a fine way to do it. But here is a different way that sticks with filters.
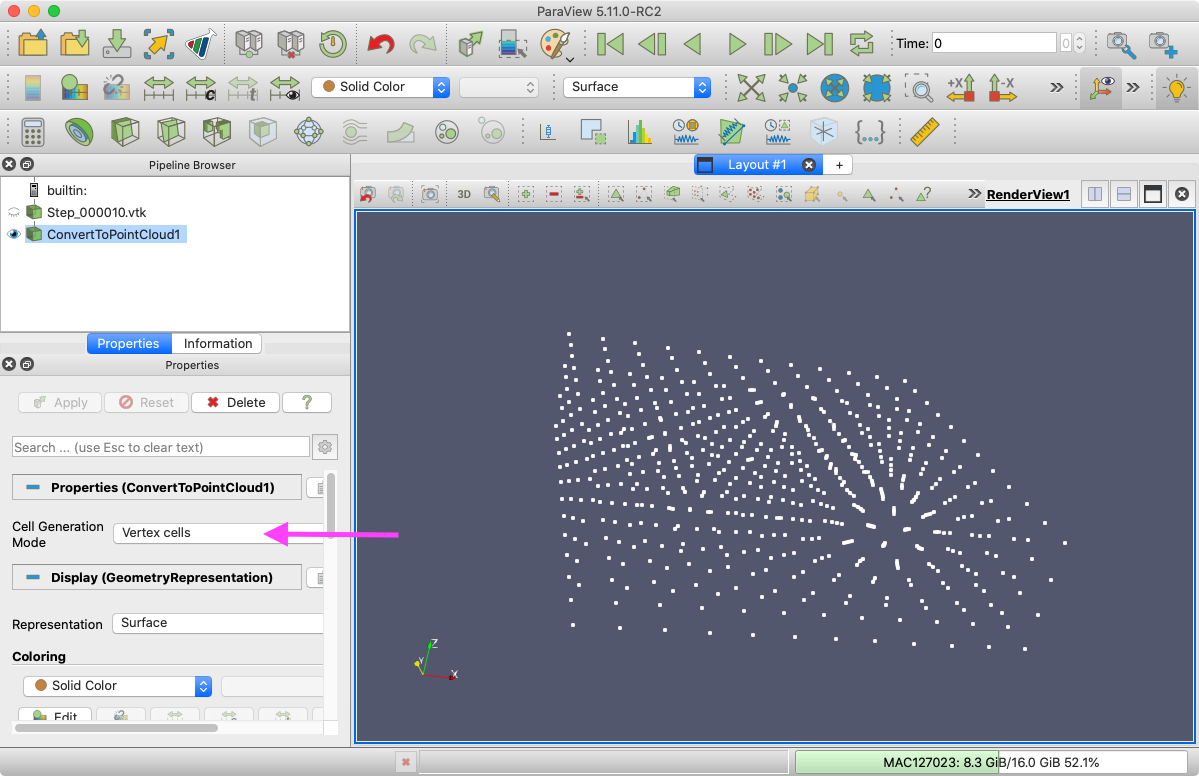
- Run the
Convert To Point Cloud filter. Change the Cell Generation Mode to Vertex cells. Apply
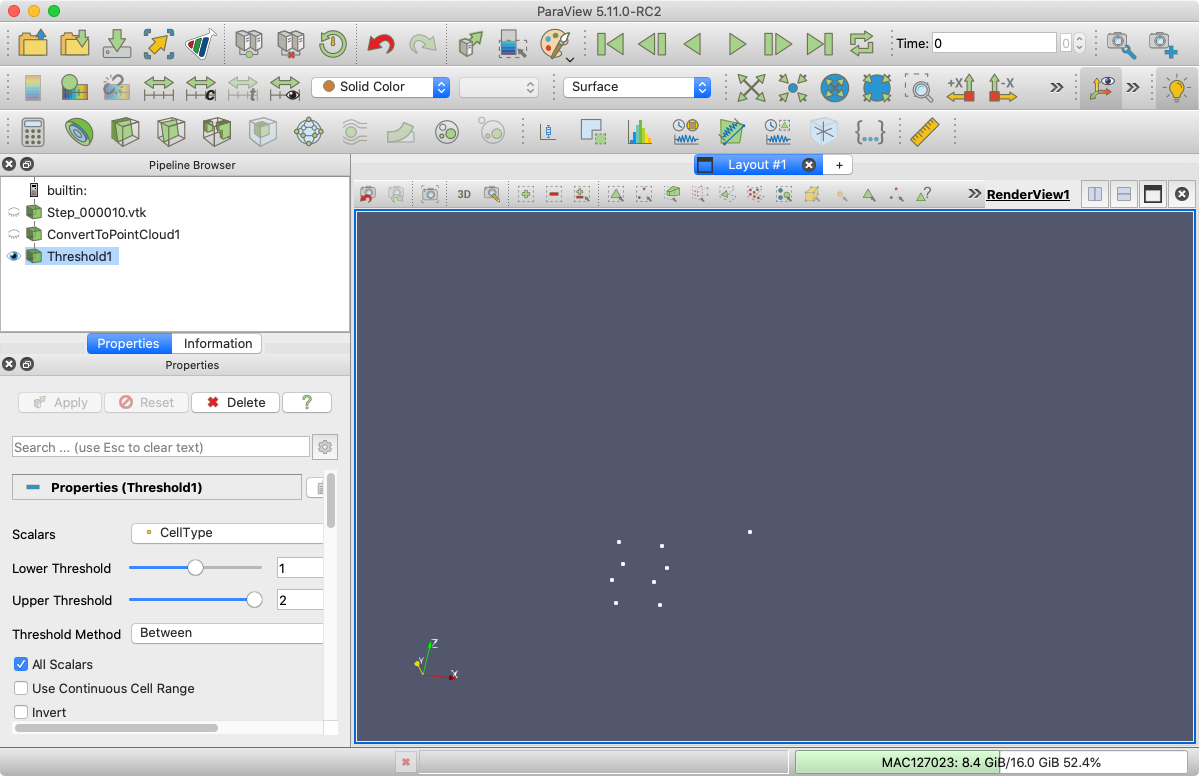
- Run the
Threshold filter as you were before.
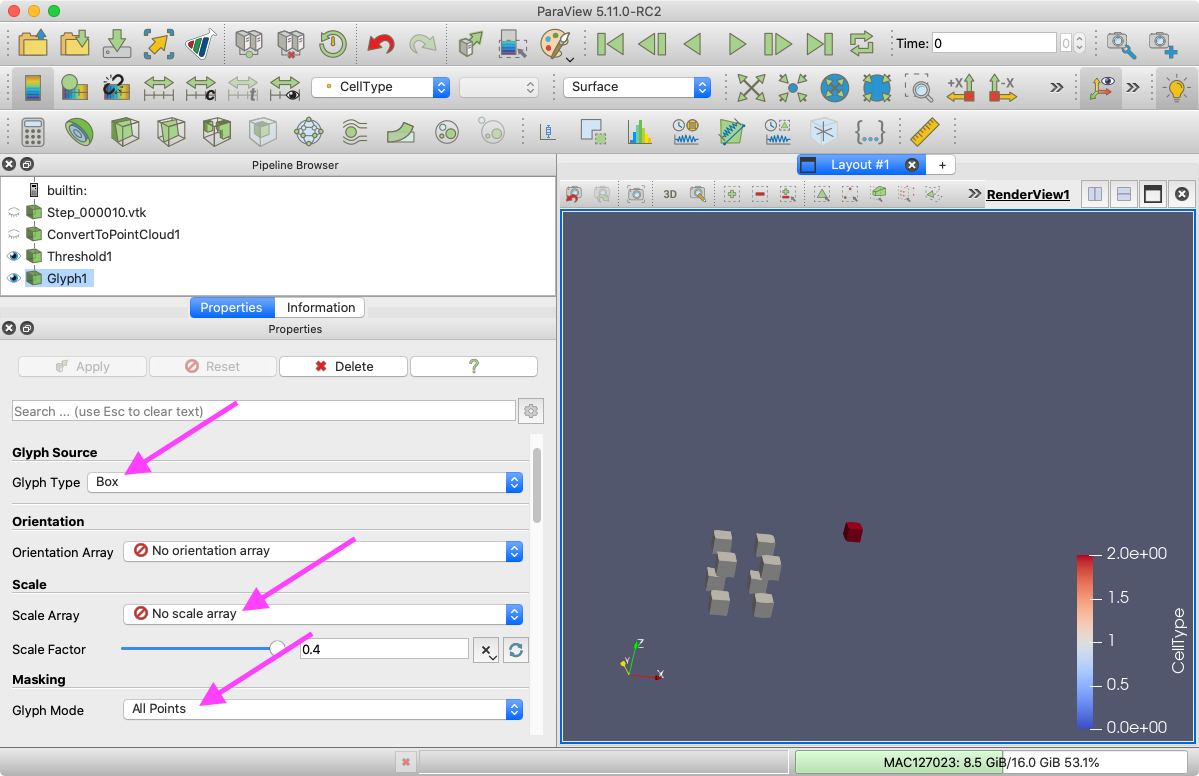
- Add the
Glyph filter  . Change the
 Glyph Type to either Box or Sphere. Set Scale Array to No scale array (unless you want them scaled). Set Glyph Mode to All Points. Apply
In this screenshot I have used box glyphs and colored by CellType.
Thanks @Kenneth_Moreland! That is exactly what I wanted!
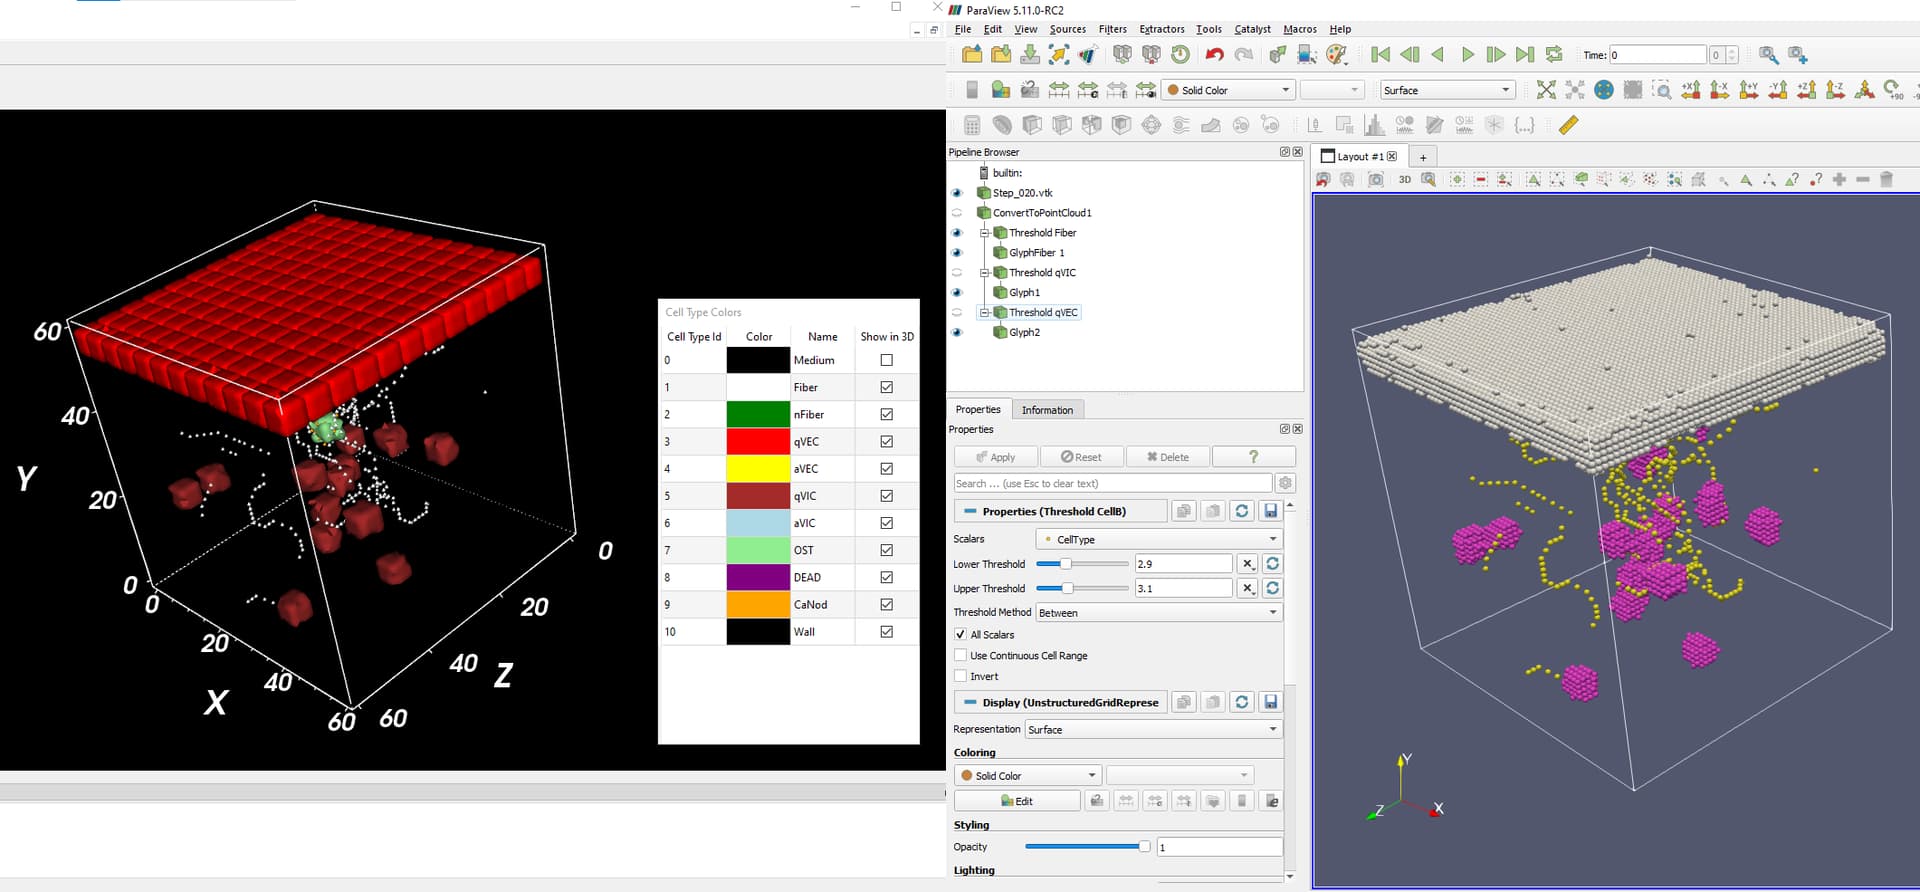
I am trying to visuals some biological cells which are combination of some points, and trying to render the surface of the cells rather than just single points. Do you know anyway that I can render them like the figure on the left? (each biological cell has cell id associated with the points)
I would appreciate you idea dear @Kenneth_Moreland.
The files are in the link below:
https://drive.google.com/drive/folders/1o7vCYcditlI5ZHQGYU0P7KWc19lbCmF7?usp=share_link
It would probably be better if this question was opened in a new post to prevent confusion.
This is tricky to do in ParaView and I don’t have a great answer. The biological cells are not directly represented in the data. Rather, you have to extract a group based on the CellId and then find a surrounding surface (such as a convex hull) around that. ParaView does not have anything to do that automatically. You might be able to write a filter that iterates over all possible cell ids, extract them, get the convex hull with something like Delauny3D, and collect the results. But that is not trivial to code and fairly slow. Something more custom would be better, but again that doesn’t exist.
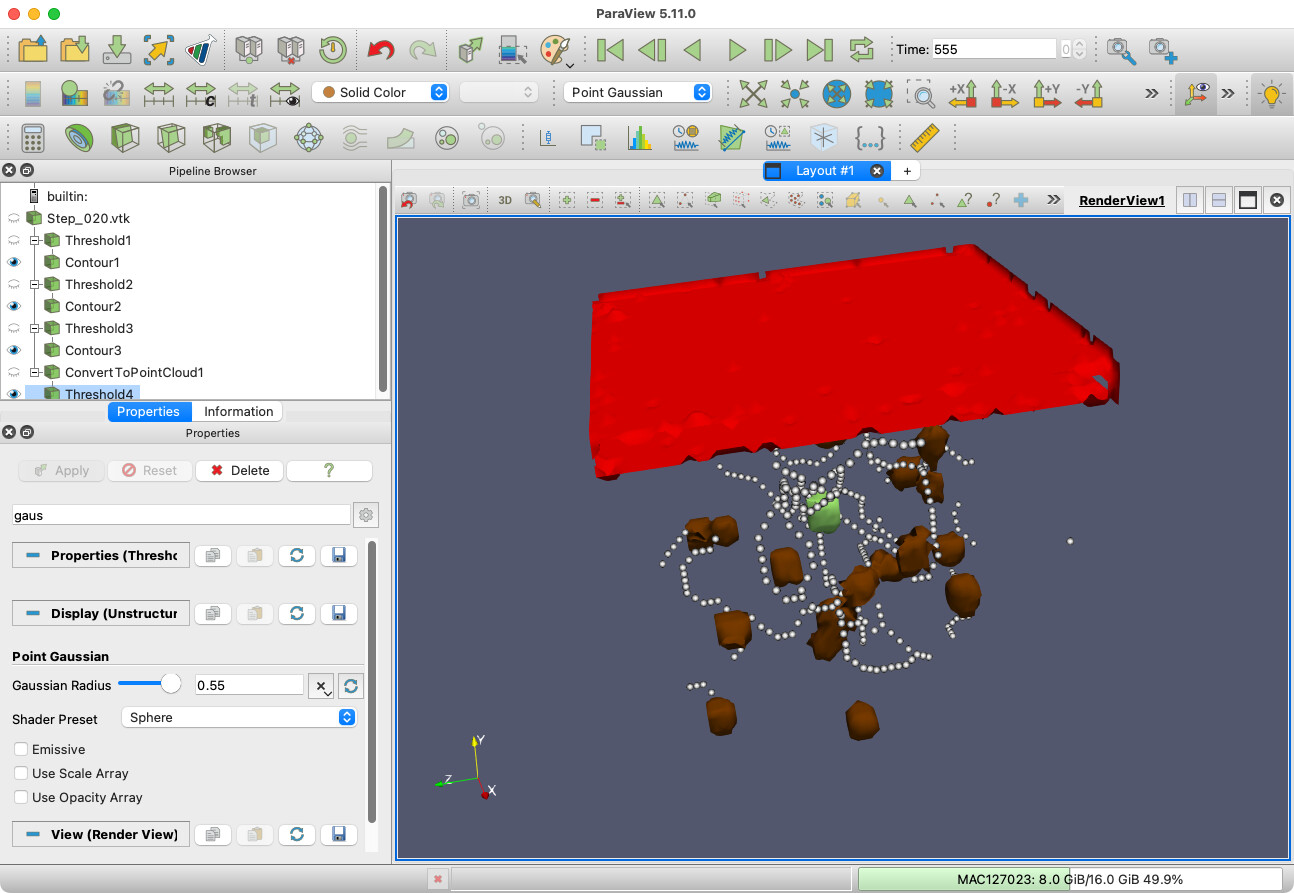
You might be able to get something close by extracting cells from the original dataset (before calling Convert To Point Cloud) based in the CellType (unchecking the All Scalars option) and then using the Contour filter to get a reasonable (if approximate) boundary. It works reasonably well for biological cells that are spaced out (like qVIC) but it does not separate biological cells that touch (like qVEC). Here is what I got with that:
Here is the state file that I used to produce this:
contour-bio-cells.pvsm (1.1 MB)
Thanks @Kenneth_Moreland! This is good!