Goal:
I want to visualize the electric field generated around the edges of the electrodes, when the plasma is generated.
Problem:
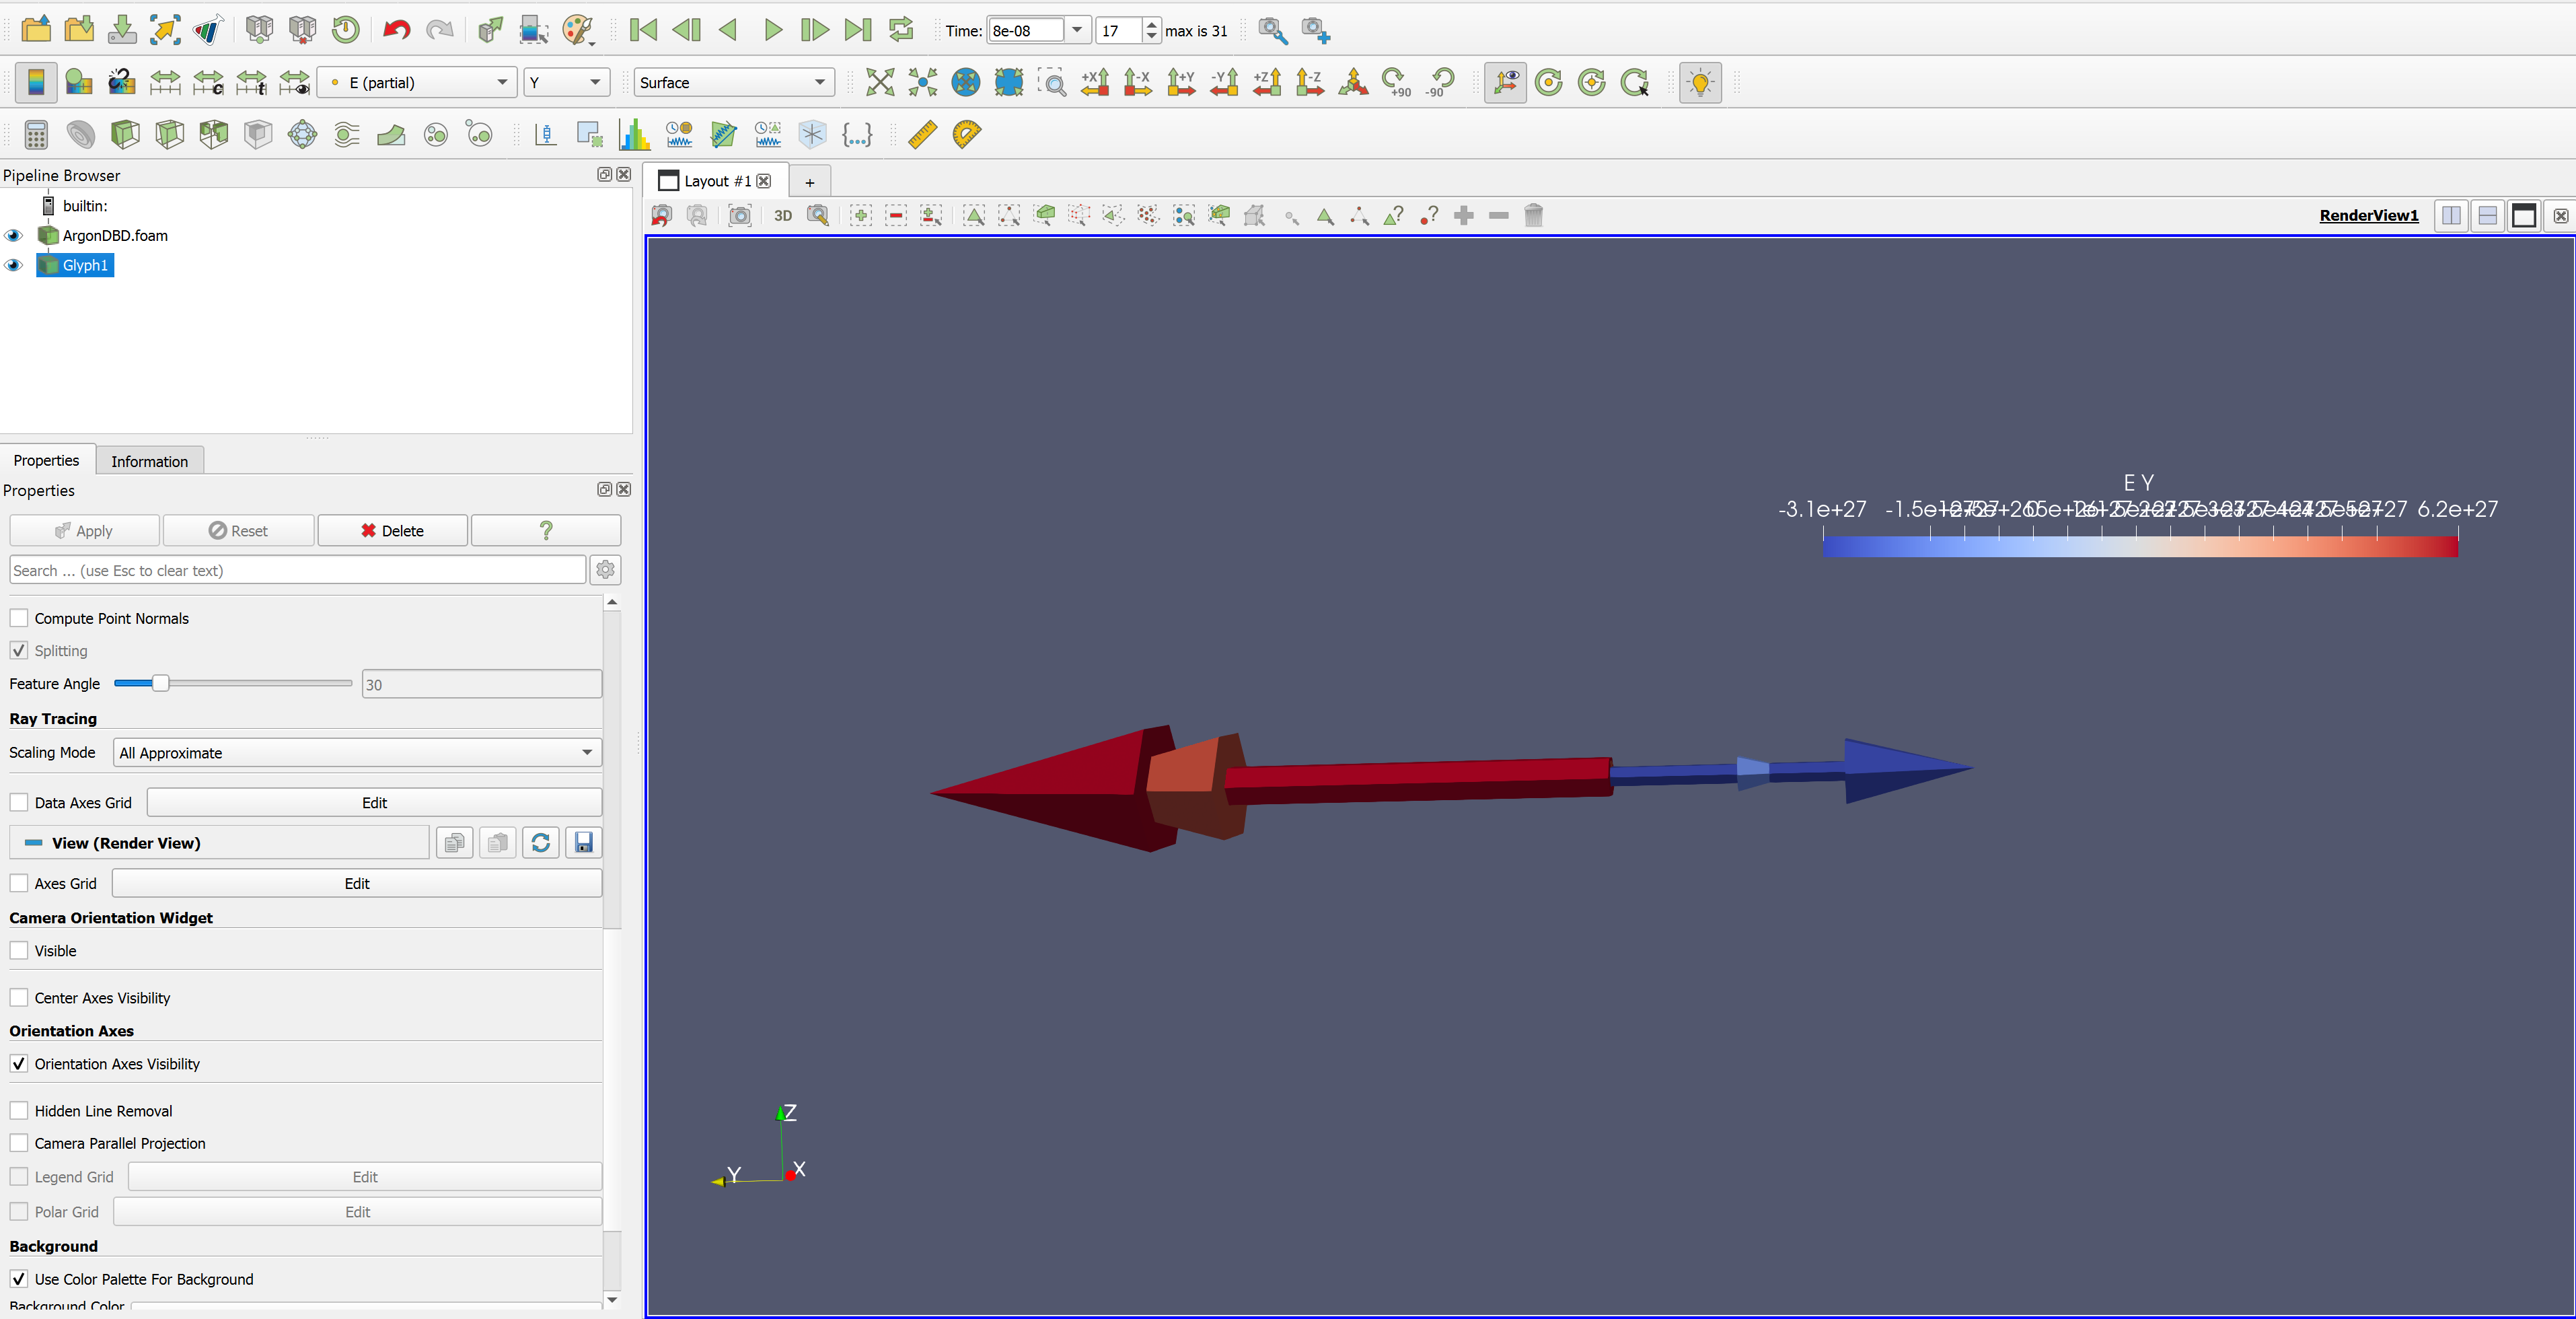
I tried using the Glyph filter, but instead of getting a field, I get single arrows coming out from the sides. I am relatively new to this domain, and I have little idea on what is going on.
If it matters, my setup is:
Ubuntu 18.04 on WSL. I run the command blockMesh and somaFoam (the solver), and it runs the simulation. Once the simulation is run, the *.foam file is opened in ParaView 5.13.3 (on Windows).
Help Needed:
How can I visualize the electric fields better?
Hello. Thank you for responding.
I did play with the scale factor. The current (not in the picture) Scale Factor is: 0.00000000000001.
The problem is, I expect to see fields, but instead, it shows just two arrows, as shown in the image. I think my method to visualize the electric field is incorrect.
I am very sorry, but I am not sure if I follow.
Do you want me to share the .vtk files? The file that I have imported in ParaView is ".foam" file.
Again, I am very sorry for not following.
I will have to learn how to do that. Can you please tell me which file you used to get that image?
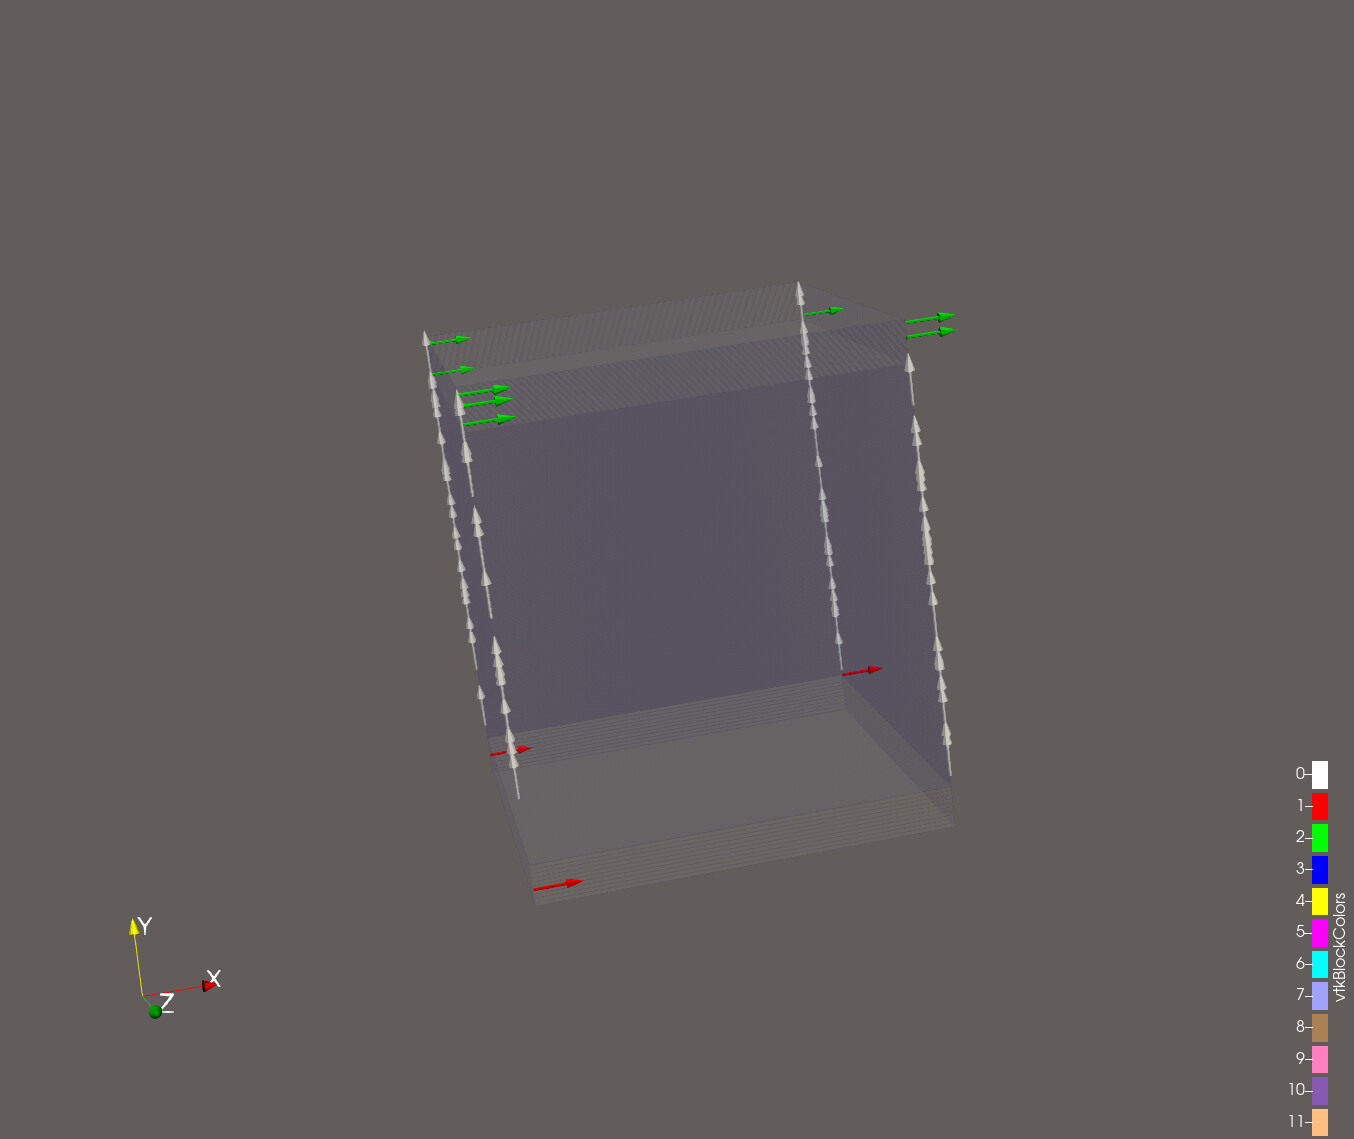
I believe more data around the edges should exist at Time #17 (8e-08). We run the simulation and after few micro or milli seconds, the voltage field is generated.
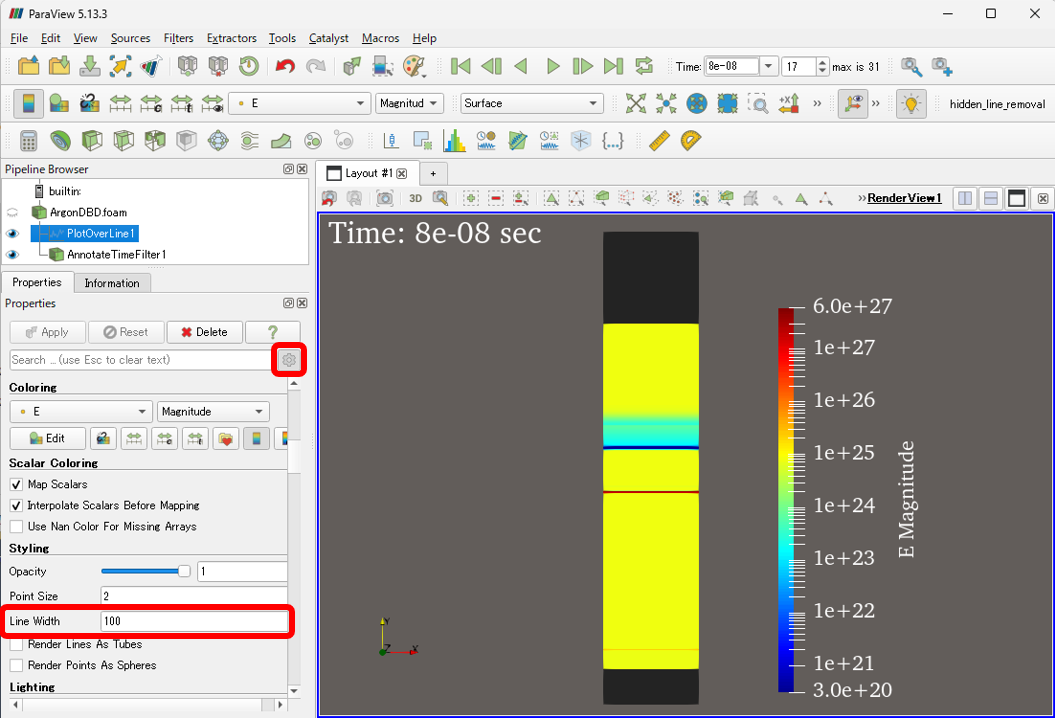
Isn’t it possible that this analysis is being performed with a 1D analysis model? For example, the following link also describes a 1D analysis:
While OpenFOAM primarily handles 3D models, when you want to perform a 1D simulation, “empty” boundary conditions are applied to two dimensions, leaving only one dimension active for calculation. In fact, in this example, the type keyword for otherfaces within the boundary file in the processor0\constant\polyMesh directory is set to empty.
Thank you so much for sharing this PDF.
If I understand your comment well, are you saying that my example is already “good enough” for a 1-D visualization? And I should be able to achieve what I want to? i.e., I should be able to see the electric field from the edge of the electrode when plasma is generated by selecting appropriate filters?
Thank you so much for the efforts. Please excuse me for asking some basic questions. I am extremely new to this tool and the technology.
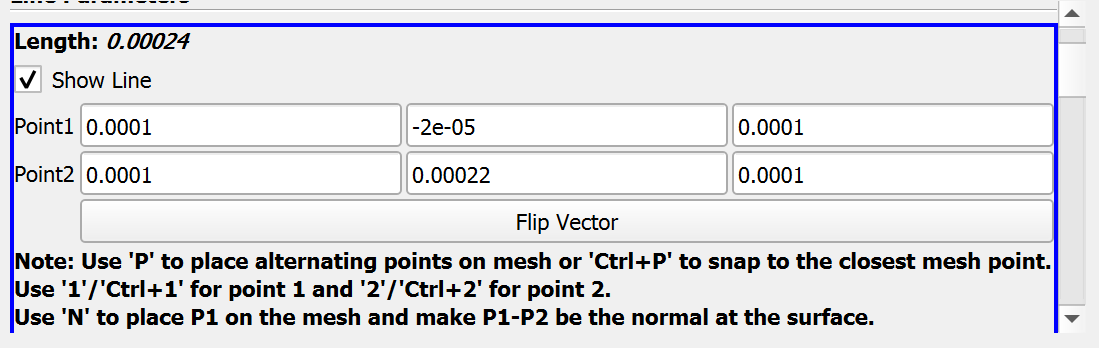
How did you figure out the values required for the field “Line Parameters”? I am given to understand that it is the most important part for viewing this plot. My previous attempts had been unsuccessful because I could not figure out the right values for this field.
How do I know if the visuals are from the edge of the electrode?
I clicked the “Y Axis” button without specifically considering the start and end points of the line.
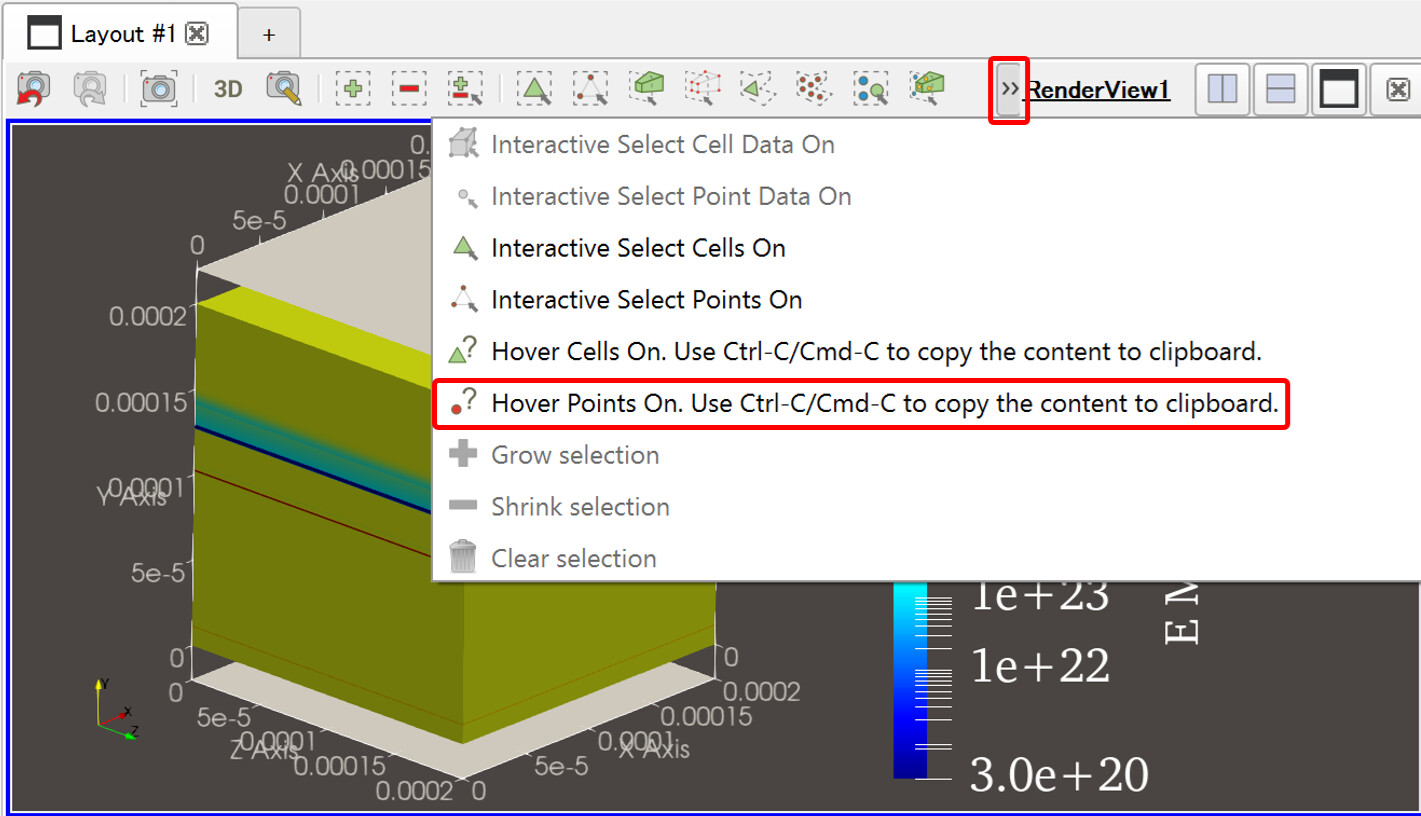
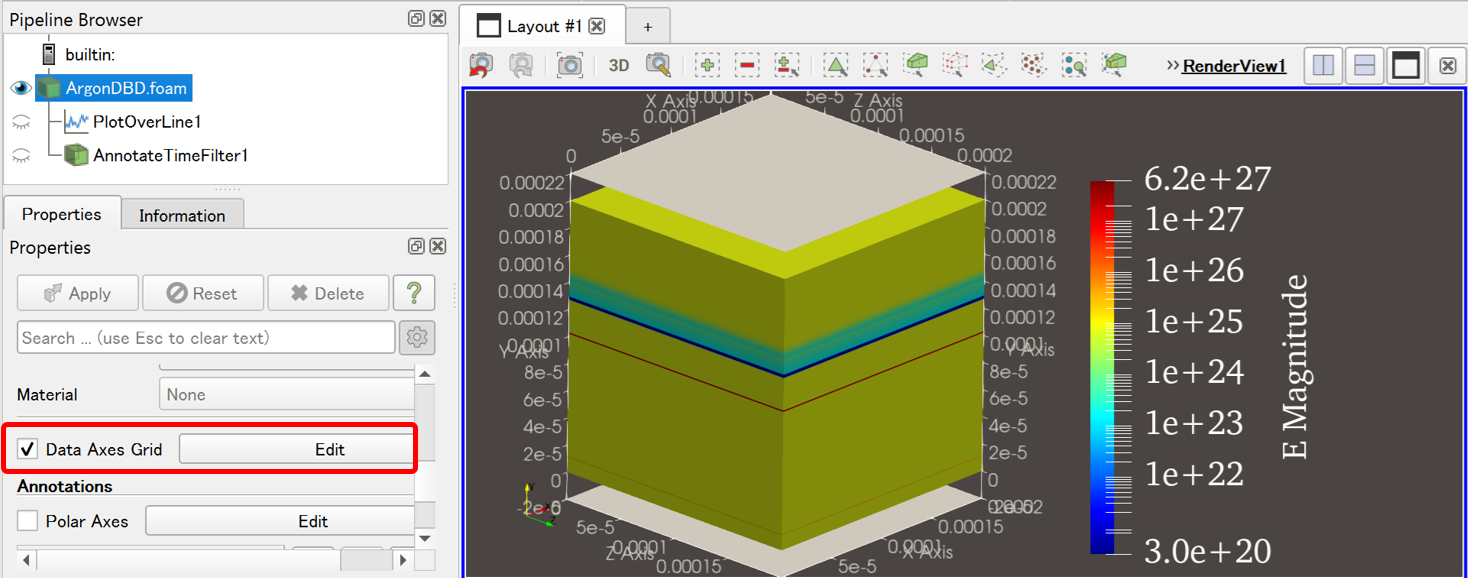
If you mean you want to set the Y-coordinates of the electrode as the start and end points of the line, you can find the Y-coordinates using the following method:
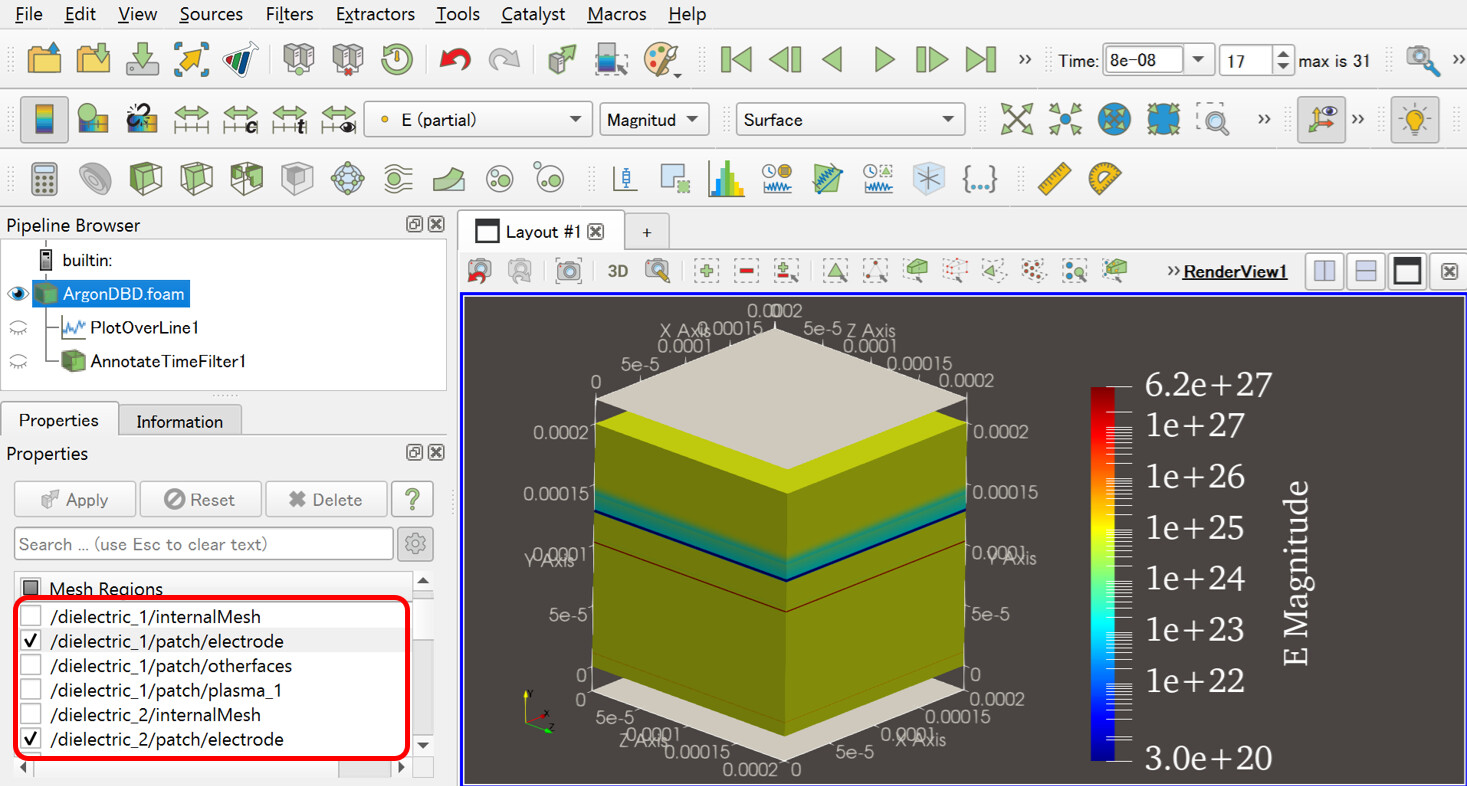
2.1. In the OpenFOAM Reader settings, check both /dielectric_1/patch/electrode and /dielectric_2/patch/electrode and load them.