I have a csv file with 3 columns. The first and second columns are x,y coordinates of mesh boundary points. The third column is an integer that tells which boundary the point is a part of.
Here is an example file: boundaries.csv (2.4 KB)
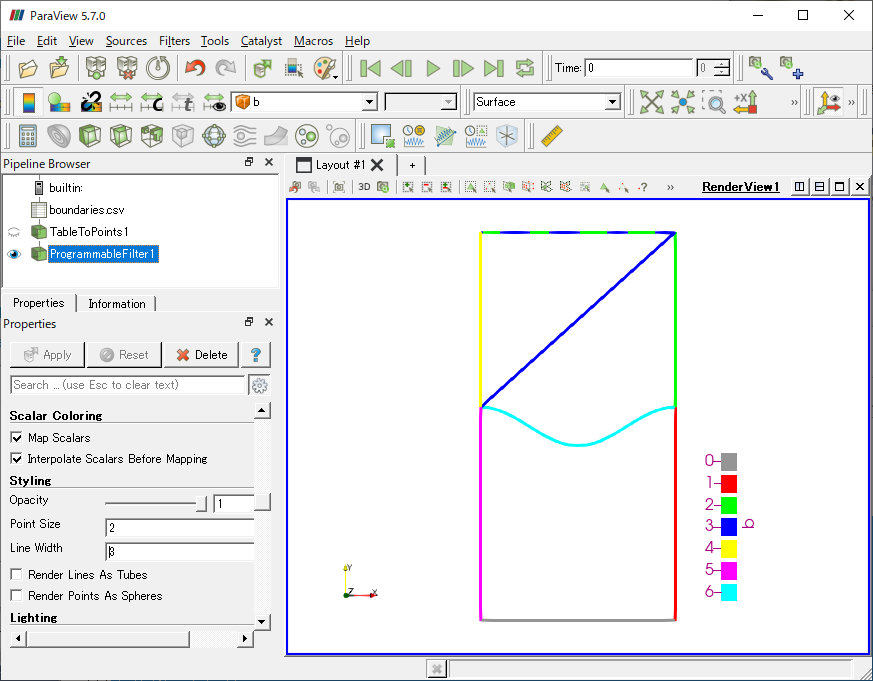
I would like to visualize the boundaries as distinct lines. So far I have only gotten them to show as sets of differently colored points using the TableToPoints filter by activating the “2d” and “Keep All Data Arrays” options:
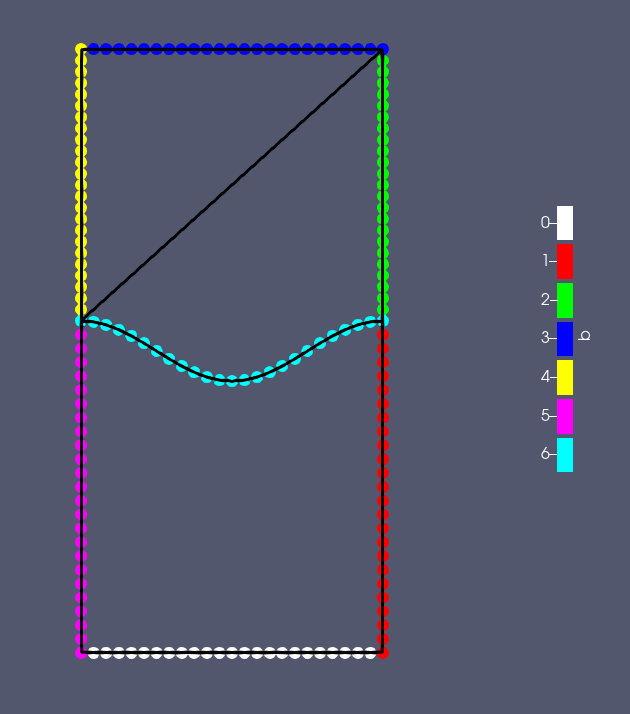
With a python script for the programmable filter from here: https://public.kitware.com/pipermail/paraview/2014-March/030781.html, I managed to add the black lines.
For completeness, the script is:
pdi = self.GetPolyDataInput()
pdo =  self.GetPolyDataOutput()
numPoints = pdi.GetNumberOfPoints()
pdo.Allocate()
for i in range(0, numPoints-1):
	 points = [i, i+1]
	 # VTK_LINE is 3
	 pdo.InsertNextCell(3, 2, points)
I would like to have separate lines from the points for each boundary. Is that possible?
if not, is it possible to extract lines based on the boundary index?
I have tried with this script:
pdi = self.GetPolyDataInput()
pdo =  self.GetPolyDataOutput()
numPoints = pdi.GetNumberOfPoints()
pdo.Allocate()
counter=0
for i in range(0, numPoints-1):
	coord = pdi.GetPoint(i)
	b = coord[0]
	if b==6.0:
		points = [counter, counter+1]
		counter += 1
		pdo.InsertNextCell(3, 2, points)				# VTK_LINE is 3
But I did not find a function to access the boundary index.